


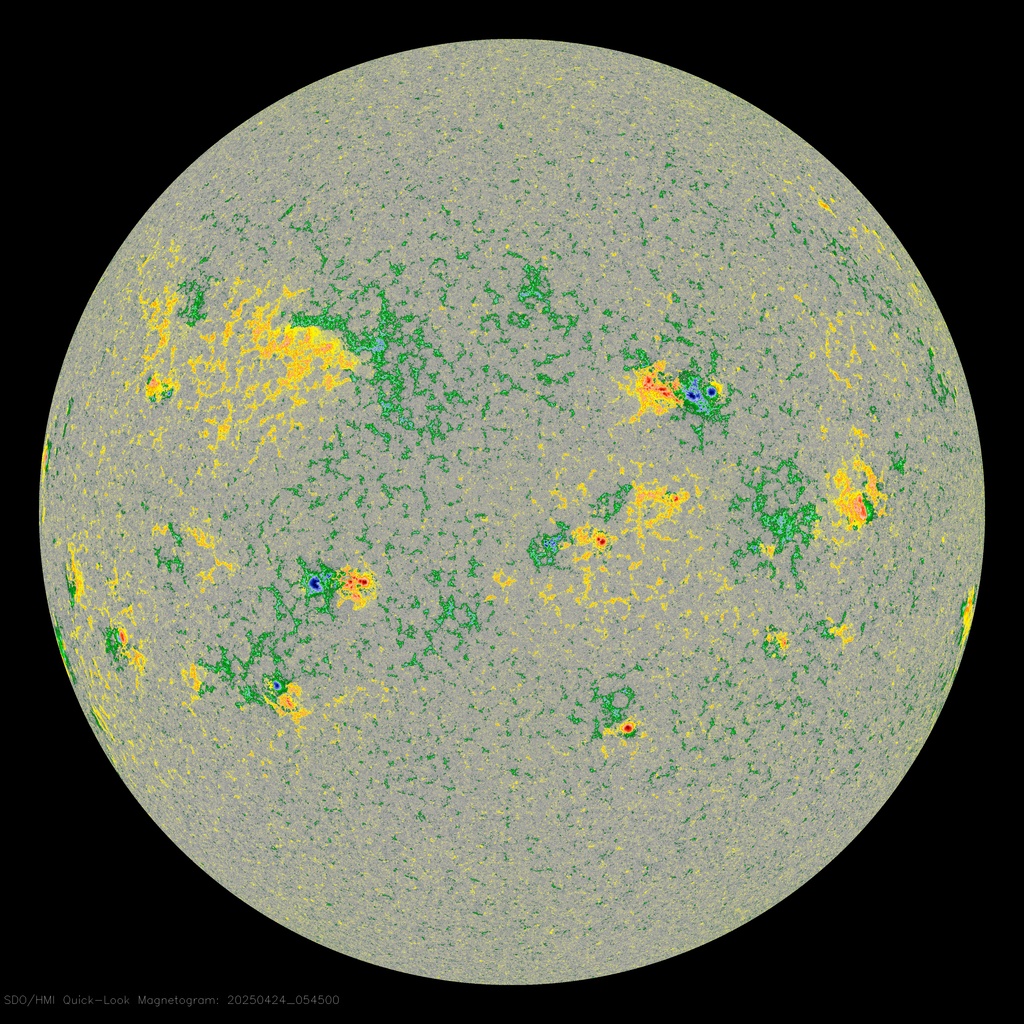
Magnetograms show maps of the magnetic field on the Sun’s surface. It shows the magnetic field directions near the surface of the Sun. White/red and black/blue areas indicate opposite magnetic polarities, with white/red showing north (outward) polarity and black/blue showing south (inward) polarity.
The sun emits light in all colours, but since yellow is the brightest wavelength from the sun, that is the colour we see with our naked eye. Specialized instruments can observe light far beyond the ranges visible to the naked eye. Different wavelengths convey information about different components of the sun’s surface and atmosphere.
The Solar Dynamics Observatory, or SDO, images 10 different wavelengths, measured in angstroms (Å), with its Atmospheric Imaging Assembly (AIA) instrument. SDO’s Helioseismic and Magnetic Imager (HMI) instrument focuses on the movement and magnetic properties of the sun’s surface and provides 3 additional images.
The video on this page links to Tamitha Skov’s Youtube video where she explains how to read HMI Magnetogram images.
SDO provides ultra-high-definition imagery of the Sun in 13 different wavelengths, utilizing two imaging instruments, the Atmospheric Imaging Assembly (AIA) instrument and the Helioseismic and Magnetic Imager (HMI).
The video below shows the Solar Dynamics Observatory (SDO) testing and preparation before being placed atop an Atlas V for launch.
Below: Tamitha Skov explains how to read magnetograms


