
On this page, you’ll find daily solar data which is more or less in real-time. The data is sourced directly from NOAA via a live JSON feed, so every time you refresh this page, the feed will also be refreshed and tables updated if NOAA has updated the feed. You’ll also find detailed solar region information.
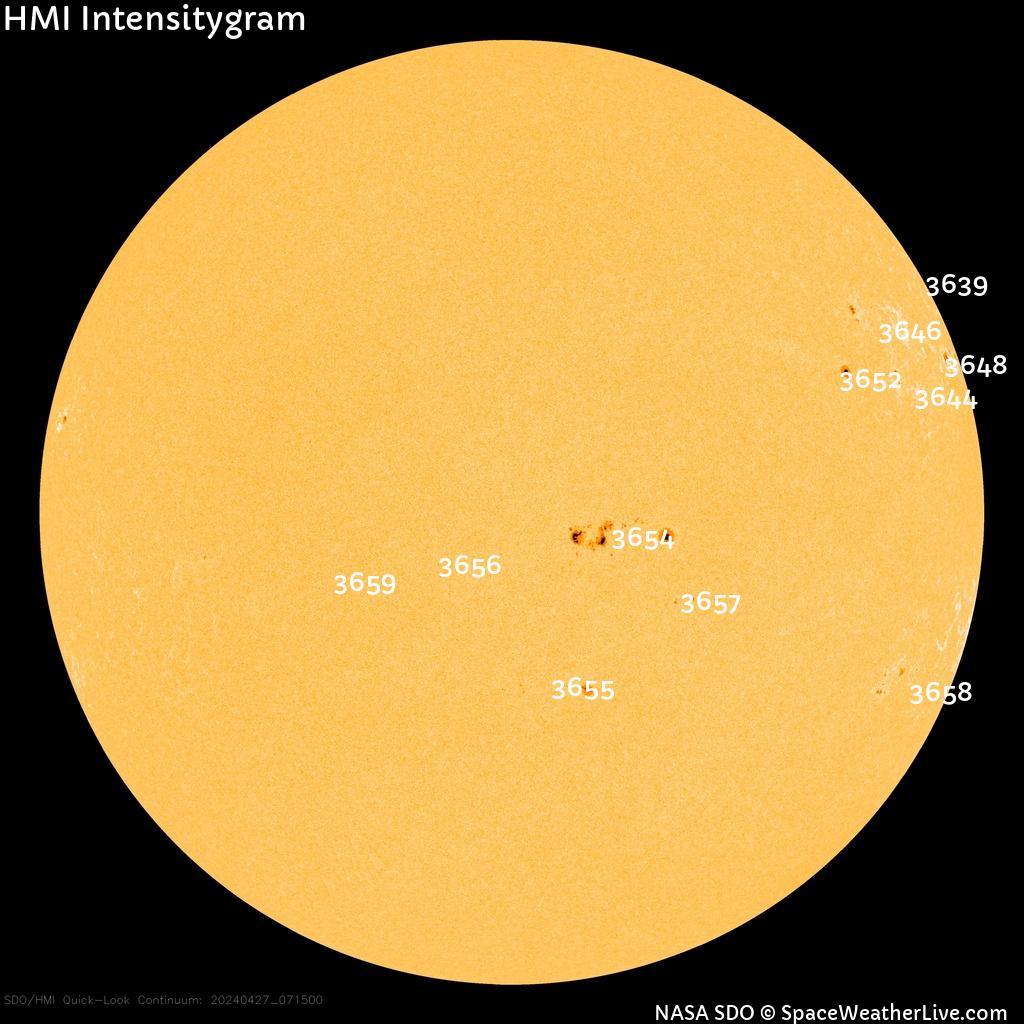
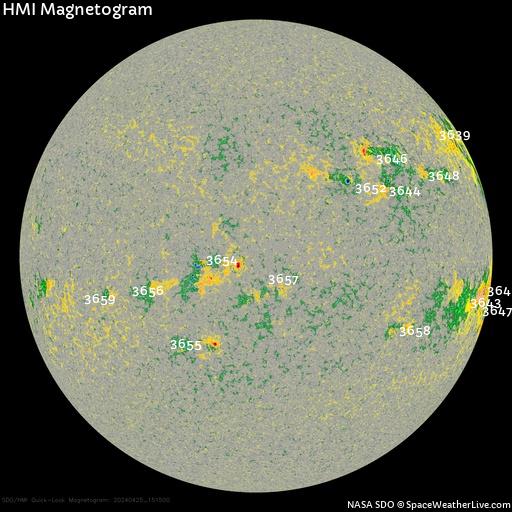
Solar regions are numbered, and further down the page, you’ll see a current image of the sun that shows where the regions are.
The table shows the region’s size (area), the number of spots in the region, the magnetic characterisation of the spot, along with the chance of a C, M and X class flare. The table below that shows the level of Solar Flux (SFI) which is the key indicator for HF radio propagation, and below that are SFI levels over the past few weeks.
There is more general information on the space weather page.
The graph below highlights the Solar Flux (SFI) over the past month. For good DX, the solar flux should remain above about 150 for a few days with the K index below 2. The k index will rise after a solar flare. This graph is almost real-time and is sourced from NOAA.
If you’ve come to this page from Facebook, please refresh this page.
| Date / Time | Flux | frequency | Reporting Time | avg_begin_date | 90 Day prior Average SFI | rec_count |
|---|---|---|---|---|---|---|
| 02-05-2025 | 153 | 2.800 | Afternoon | |||
| 02-05-2025 | 152 | 2.800 | Noon | 02-02-2025 20:00 | 169 | 90 |
| 02-05-2025 | 151 | 2.800 | Morning | |||
| 01-05-2025 | 152 | 2.800 | Afternoon | |||
| 01-05-2025 | 152 | 2.800 | Noon | 01-02-2025 20:00 | 170 | 90 |
| 01-05-2025 | 150 | 2.800 | Morning | |||
| 30-04-2025 | 147 | 2.800 | Afternoon | |||
| 30-04-2025 | 148 | 2.800 | Noon | 31-01-2025 20:00 | 170 | 90 |
| 30-04-2025 | 149 | 2.800 | Morning | |||
| 29-04-2025 | 150 | 2.800 | Afternoon | |||
| 29-04-2025 | 149 | 2.800 | Noon | 30-01-2025 20:00 | 171 | 90 |
| 29-04-2025 | 150 | 2.800 | Morning | |||
| 28-04-2025 | 153 | 2.800 | Afternoon | |||
| 28-04-2025 | 154 | 2.800 | Noon | 29-01-2025 20:00 | 171 | 90 |
| 28-04-2025 | 154 | 2.800 | Morning | |||
| 27-04-2025 | 154 | 2.800 | Afternoon | |||
| 27-04-2025 | 156 | 2.800 | Noon | 28-01-2025 20:00 | 171 | 90 |
| 27-04-2025 | 153 | 2.800 | Morning | |||
| 26-04-2025 | 156 | 2.800 | Afternoon | |||
| 26-04-2025 | 156 | 2.800 | Noon | 27-01-2025 20:00 | 171 | 90 |
| 26-04-2025 | 154 | 2.800 | Morning | |||
| 25-04-2025 | 164 | 2.800 | Afternoon | |||
| 25-04-2025 | 164 | 2.800 | Noon | 26-01-2025 20:00 | 171 | 90 |
| 25-04-2025 | 164 | 2.800 | Morning | |||
| 24-04-2025 | 169 | 2.800 | Afternoon | |||
| 24-04-2025 | 170 | 2.800 | Noon | 25-01-2025 20:00 | 172 | 90 |
| 24-04-2025 | 169 | 2.800 | Morning | |||
| 23-04-2025 | 169 | 2.800 | Afternoon | |||
| 23-04-2025 | 167 | 2.800 | Noon | 24-01-2025 20:00 | 172 | 90 |
| 23-04-2025 | 165 | 2.800 | Morning | |||
| 22-04-2025 | 164 | 2.800 | Afternoon | |||
| 22-04-2025 | 163 | 2.800 | Noon | 23-01-2025 20:00 | 173 | 90 |
| 22-04-2025 | 161 | 2.800 | Morning | |||
| 21-04-2025 | 159 | 2.800 | Afternoon | |||
| 21-04-2025 | 163 | 2.800 | Noon | 22-01-2025 20:00 | 173 | 90 |
| 21-04-2025 | 160 | 2.800 | Morning | |||
| 20-04-2025 | 157 | 2.800 | Afternoon | |||
| 20-04-2025 | 156 | 2.800 | Noon | 21-01-2025 20:00 | 174 | 90 |
| 20-04-2025 | 157 | 2.800 | Morning | |||
| 19-04-2025 | 157 | 2.800 | Afternoon | |||
| 19-04-2025 | 157 | 2.800 | Noon | 20-01-2025 20:00 | 175 | 90 |
| 19-04-2025 | 159 | 2.800 | Morning | |||
| 18-04-2025 | 157 | 2.800 | Afternoon | |||
| 18-04-2025 | 156 | 2.800 | Noon | 19-01-2025 20:00 | 175 | 90 |
| 18-04-2025 | 155 | 2.800 | Morning | |||
| 17-04-2025 | 153 | 2.800 | Afternoon | |||
| 17-04-2025 | 151 | 2.800 | Noon | 18-01-2025 20:00 | 176 | 90 |
| 17-04-2025 | 150 | 2.800 | Morning | |||
| 16-04-2025 | 148 | 2.800 | Afternoon | |||
| 16-04-2025 | 148 | 2.800 | Noon | 17-01-2025 20:00 | 177 | 90 |
| 16-04-2025 | 148 | 2.800 | Morning | |||
| 15-04-2025 | 151 | 2.800 | Afternoon | |||
| 15-04-2025 | 153 | 2.800 | Noon | 16-01-2025 20:00 | 178 | 90 |
| 15-04-2025 | 152 | 2.800 | Morning | |||
| 14-04-2025 | 160 | 2.800 | Afternoon | |||
| 14-04-2025 | 152 | 2.800 | Noon | 15-01-2025 20:00 | 178 | 90 |
| 14-04-2025 | 150 | 2.800 | Morning | |||
| 13-04-2025 | 162 | 2.800 | Afternoon | |||
| 13-04-2025 | 164 | 2.800 | Noon | 14-01-2025 20:00 | 178 | 90 |
| 13-04-2025 | 160 | 2.800 | Morning | |||
| 12-04-2025 | 165 | 2.800 | Afternoon | |||
| 12-04-2025 | 165 | 2.800 | Noon | 13-01-2025 20:00 | 178 | 90 |
| 12-04-2025 | 163 | 2.800 | Morning | |||
| 11-04-2025 | 172 | 2.800 | Afternoon | |||
| 11-04-2025 | 170 | 2.800 | Noon | 12-01-2025 20:00 | 178 | 90 |
| 11-04-2025 | 163 | 2.800 | Morning | |||
| 10-04-2025 | 158 | 2.800 | Afternoon | |||
| 10-04-2025 | 153 | 2.800 | Noon | 11-01-2025 20:00 | 178 | 90 |
| 10-04-2025 | 153 | 2.800 | Morning | |||
| 09-04-2025 | 170 | 2.800 | Afternoon | |||
| 09-04-2025 | 167 | 2.800 | Noon | 10-01-2025 20:00 | 178 | 90 |
| 09-04-2025 | 156 | 2.800 | Morning | |||
| 08-04-2025 | 168 | 2.800 | Afternoon | |||
| 08-04-2025 | 159 | 2.800 | Noon | 09-01-2025 20:00 | 178 | 90 |
| 08-04-2025 | 159 | 2.800 | Morning | |||
| 07-04-2025 | 162 | 2.800 | Afternoon | |||
| 07-04-2025 | 162 | 2.800 | Noon | 08-01-2025 20:00 | 178 | 90 |
| 07-04-2025 | 163 | 2.800 | Morning | |||
| 06-04-2025 | 167 | 2.800 | Afternoon | |||
| 06-04-2025 | 167 | 2.800 | Noon | 07-01-2025 20:00 | 178 | 90 |
| 06-04-2025 | 168 | 2.800 | Morning | |||
| 05-04-2025 | 184 | 2.800 | Noon | 06-01-2025 20:00 | 178 | 90 |
| 05-04-2025 | 180 | 2.800 | Morning | |||
| 04-04-2025 | 180 | 2.800 | Afternoon | |||
| 04-04-2025 | 180 | 2.800 | Noon | 05-01-2025 20:00 | 178 | 90 |
| 04-04-2025 | 180 | 2.800 | Morning | |||
| 03-04-2025 | 178 | 2.800 | Afternoon | |||
| 03-04-2025 | 178 | 2.800 | Noon | 04-01-2025 20:00 | 178 | 90 |
| 03-04-2025 | 175 | 2.800 | Morning | |||
| 02-04-2025 | 177 | 2.800 | Afternoon | |||
| 02-04-2025 | 180 | 2.800 | Noon | 03-01-2025 20:00 | 178 | 90 |
| 02-04-2025 | 175 | 2.800 | Morning | |||
| 01-04-2025 | 184 | 2.800 | Afternoon | |||
| 01-04-2025 | 182 | 2.800 | Noon | 02-01-2025 20:00 | 179 | 90 |
| 01-04-2025 | 178 | 2.800 | Morning | |||
| 31-03-2025 | 172 | 2.800 | Afternoon | |||
| 31-03-2025 | 172 | 2.800 | Noon | 01-01-2025 20:00 | 179 | 90 |
| 31-03-2025 | 169 | 2.800 | Morning | |||
| 30-03-2025 | 171 | 2.800 | Afternoon | |||
| 30-03-2025 | 171 | 2.800 | Noon | 31-12-2024 20:00 | 180 | 90 |
| 30-03-2025 | 170 | 2.800 | Morning | |||
| 29-03-2025 | 169 | 2.800 | Afternoon | |||
| 29-03-2025 | 157 | 2.800 | Noon | 30-12-2024 20:00 | 180 | 90 |
| 29-03-2025 | 155 | 2.800 | Morning | |||
| 28-03-2025 | 156 | 2.800 | Afternoon | |||
| 28-03-2025 | 160 | 2.800 | Noon | 29-12-2024 20:00 | 181 | 90 |
| 28-03-2025 | 169 | 2.800 | Morning | |||
| 27-03-2025 | 161 | 2.800 | Afternoon | |||
| 27-03-2025 | 153 | 2.800 | Noon | 28-12-2024 20:00 | 182 | 90 |
| 27-03-2025 | 157 | 2.800 | Morning | |||
| 26-03-2025 | 154 | 2.800 | Afternoon | |||
| 26-03-2025 | 152 | 2.800 | Noon | 27-12-2024 20:00 | 184 | 90 |
| 26-03-2025 | 158 | 2.800 | Morning | |||
| 25-03-2025 | 153 | 2.800 | Afternoon | |||
| 25-03-2025 | 156 | 2.800 | Noon | 26-12-2024 20:00 | 185 | 90 |
| 25-03-2025 | 154 | 2.800 | Morning | |||
| 24-03-2025 | 155 | 2.800 | Afternoon | |||
| 24-03-2025 | 156 | 2.800 | Noon | 25-12-2024 20:00 | 186 | 90 |
| 24-03-2025 | 155 | 2.800 | Morning | |||
| 23-03-2025 | 165 | 2.800 | Afternoon | |||
| 23-03-2025 | 168 | 2.800 | Noon | 24-12-2024 20:00 | 187 | 90 |
| 23-03-2025 | 168 | 2.800 | Morning |

| Date | Region | latitude | longitude | location | carrington_longitude | old_carrington_longitude | Area | Spot Class | extent | Spots | Magnetic | mag_string | Status | c_xray_events | m_xray_events | x_xray_events | proton_events | Flares | impulse_flares_1 | impulse_flares_2 | impulse_flares_3 | impulse_flares_4 | protons | % C Flare | % M Flare | % X Flare | Proton Probability | first_date |
|---|---|---|---|---|---|---|---|---|---|---|---|---|---|---|---|---|---|---|---|---|---|---|---|---|---|---|---|---|
| 02-05-2025 | 4070 | -12,00 | -102,00 | S12W0* | 11 | 10 | 10 | Hrx | 1 | 1 | A | d | 0 | 0 | 0 | 0 | 0 | 0 | 0 | 0 | 0 | 0 | 0 | 0 | 22-04-2025 11:25 | |||
| 02-05-2025 | 4079 | 7,00 | 27,00 | N07E27 | 242 | 241 | 1.210 | Ekc | 12 | 17 | BG | f | 8 | 0 | 0 | 2 | 0 | 0 | 0 | 0 | 0 | 80 | 35 | 5 | 1 | 28-04-2025 18:05 | ||
| 02-05-2025 | 4072 | -19,00 | -57,00 | S19W57 | 326 | 325 | f | 0 | 0 | 0 | 0 | 0 | 0 | 0 | 0 | 0 | 0 | 0 | 0 | 23-04-2025 11:15 | ||||||||
| 02-05-2025 | 4077 | -17,00 | -38,00 | S17W38 | 307 | 306 | f | 0 | 0 | 0 | 0 | 0 | 0 | 0 | 0 | 0 | 0 | 0 | 0 | 25-04-2025 09:24 | ||||||||
| 02-05-2025 | 4073 | 11,00 | -70,00 | N11W70 | 339 | 338 | f | 0 | 0 | 0 | 0 | 0 | 0 | 0 | 0 | 0 | 0 | 0 | 0 | 24-04-2025 11:16 | ||||||||
| 02-05-2025 | 4078 | 15,00 | -102,00 | N15W0* | 11 | 10 | d | 0 | 0 | 0 | 0 | 0 | 0 | 0 | 0 | 0 | 0 | 0 | 0 | 28-04-2025 18:04 | ||||||||
| 02-05-2025 | 4068 | -24,00 | -86,00 | S24W86 | 355 | 354 | f | 0 | 0 | 0 | 0 | 0 | 0 | 0 | 0 | 0 | 0 | 0 | 0 | 21-04-2025 09:13 | ||||||||
| 02-05-2025 | 4076 | 6,00 | -36,00 | N06W36 | 305 | 305 | 80 | Hsx | 2 | 1 | A | f | 0 | 0 | 0 | 0 | 0 | 0 | 0 | 0 | 10 | 1 | 1 | 1 | 25-04-2025 09:23 | |||
| 02-05-2025 | 4075 | -11,00 | -50,00 | S11W50 | 319 | 318 | f | 0 | 0 | 0 | 0 | 0 | 0 | 0 | 0 | 0 | 0 | 0 | 0 | 25-04-2025 09:22 | ||||||||
| 01-05-2025 | 4072 | -19,00 | -43,00 | S19W43 | 325 | 326 | 10 | Bxo | 2 | 3 | B | f | 0 | 0 | 0 | 0 | 0 | 0 | 0 | 0 | 10 | 1 | 1 | 1 | 23-04-2025 11:15 | |||
| 01-05-2025 | 4077 | -17,00 | -24,00 | S17W24 | 306 | 305 | f | 0 | 0 | 0 | 0 | 0 | 0 | 0 | 0 | 0 | 0 | 0 | 0 | 25-04-2025 09:24 | ||||||||
| 01-05-2025 | 4073 | 11,00 | -56,00 | N11W56 | 338 | 337 | f | 0 | 0 | 0 | 0 | 0 | 0 | 0 | 0 | 0 | 0 | 0 | 0 | 24-04-2025 11:16 | ||||||||
| 01-05-2025 | 4075 | -11,00 | -36,00 | S11W36 | 318 | 317 | f | 0 | 0 | 0 | 0 | 0 | 0 | 0 | 0 | 0 | 0 | 0 | 0 | 25-04-2025 09:22 | ||||||||
| 01-05-2025 | 4076 | 5,00 | -23,00 | N05W23 | 305 | 304 | 70 | Hsx | 2 | 1 | A | f | 0 | 0 | 0 | 0 | 0 | 0 | 0 | 0 | 10 | 1 | 1 | 1 | 25-04-2025 09:23 | |||
| 01-05-2025 | 4068 | -24,00 | -72,00 | S24W72 | 354 | 353 | f | 0 | 0 | 0 | 0 | 0 | 0 | 0 | 0 | 0 | 0 | 0 | 0 | 21-04-2025 09:13 | ||||||||
| 01-05-2025 | 4079 | 8,00 | 41,00 | N08E41 | 241 | 241 | 1.200 | Ekc | 14 | 14 | BGD | f | 5 | 0 | 0 | 5 | 0 | 0 | 0 | 0 | 0 | 85 | 45 | 10 | 1 | 28-04-2025 18:05 | ||
| 01-05-2025 | 4070 | -12,00 | -88,00 | S12W88 | 10 | 6 | 10 | Hrx | 1 | 1 | A | f | 0 | 0 | 0 | 0 | 0 | 0 | 0 | 0 | 5 | 1 | 1 | 1 | 22-04-2025 11:25 | |||
| 01-05-2025 | 4078 | 15,00 | -88,00 | N15W88 | 10 | 9 | f | 0 | 0 | 0 | 0 | 0 | 0 | 0 | 0 | 0 | 0 | 0 | 0 | 28-04-2025 18:04 | ||||||||
| 30-04-2025 | 4068 | -24,00 | -58,00 | S24W58 | 353 | 352 | f | 0 | 0 | 0 | 0 | 0 | 0 | 0 | 0 | 0 | 0 | 0 | 0 | 21-04-2025 09:13 | ||||||||
| 30-04-2025 | 4070 | -12,00 | -71,00 | S12W71 | 6 | 6 | 50 | Csi | 7 | 5 | B | f | 0 | 0 | 0 | 0 | 0 | 0 | 0 | 0 | 20 | 5 | 1 | 1 | 22-04-2025 11:25 | |||
| 30-04-2025 | 4077 | -17,00 | -10,00 | S17W10 | 305 | 304 | f | 0 | 0 | 0 | 0 | 0 | 0 | 0 | 0 | 0 | 0 | 0 | 0 | 25-04-2025 09:24 | ||||||||
| 30-04-2025 | 4073 | 11,00 | -42,00 | N11W42 | 337 | 336 | f | 0 | 0 | 0 | 0 | 0 | 0 | 0 | 0 | 0 | 0 | 0 | 0 | 24-04-2025 11:16 | ||||||||
| 30-04-2025 | 4075 | -11,00 | -22,00 | S11W22 | 317 | 316 | f | 0 | 0 | 0 | 0 | 0 | 0 | 0 | 0 | 0 | 0 | 0 | 0 | 25-04-2025 09:22 | ||||||||
| 30-04-2025 | 4078 | 15,00 | -74,00 | N15W74 | 9 | 9 | 10 | Axx | 1 | 1 | A | f | 0 | 0 | 0 | 0 | 0 | 0 | 0 | 0 | 5 | 1 | 1 | 1 | 28-04-2025 18:04 | |||
| 30-04-2025 | 4069 | -7,00 | -102,00 | S07W0* | 37 | 35 | d | 0 | 0 | 0 | 0 | 0 | 0 | 0 | 0 | 0 | 0 | 0 | 0 | 22-04-2025 11:24 | ||||||||
| 30-04-2025 | 4076 | 6,00 | -9,00 | N06W09 | 304 | 304 | 70 | Hsx | 2 | 1 | A | f | 0 | 0 | 0 | 0 | 0 | 0 | 0 | 0 | 5 | 1 | 1 | 1 | 25-04-2025 09:23 | |||
| 30-04-2025 | 4065 | -31,00 | -105,00 | S31W0* | 40 | 39 | 20 | Hsx | 1 | 1 | A | d | 0 | 0 | 0 | 0 | 0 | 0 | 0 | 0 | 0 | 0 | 0 | 0 | 17-04-2025 17:40 | |||
| 30-04-2025 | 4072 | -18,00 | -31,00 | S18W31 | 326 | 326 | 20 | Cai | 3 | 7 | B | f | 0 | 0 | 0 | 0 | 0 | 0 | 0 | 0 | 45 | 10 | 1 | 1 | 23-04-2025 11:15 | |||
| 30-04-2025 | 4079 | 8,00 | 54,00 | N08E54 | 241 | 241 | 1.040 | Ekc | 14 | 13 | BG | f | 4 | 1 | 0 | 2 | 0 | 1 | 0 | 0 | 0 | 80 | 35 | 10 | 1 | 28-04-2025 18:05 | ||
| 29-04-2025 | 4068 | -24,00 | -44,00 | S24W44 | 352 | 353 | 10 | Axx | 1 | 1 | A | f | 0 | 0 | 0 | 0 | 0 | 0 | 0 | 0 | 5 | 1 | 1 | 1 | 21-04-2025 09:13 | |||
| 29-04-2025 | 4073 | 11,00 | -28,00 | N11W28 | 336 | 335 | f | 0 | 0 | 0 | 0 | 0 | 0 | 0 | 0 | 0 | 0 | 0 | 0 | 24-04-2025 11:16 | ||||||||
| 29-04-2025 | 4067 | -4,00 | -98,00 | S04W98 | 46 | 44 | d | 0 | 0 | 0 | 0 | 0 | 0 | 0 | 0 | 0 | 0 | 0 | 0 | 18-04-2025 10:58 | ||||||||
| 29-04-2025 | 4075 | -11,00 | -8,00 | S11W08 | 316 | 316 | f | 1 | 0 | 0 | 1 | 0 | 0 | 0 | 0 | 0 | 0 | 0 | 0 | 0 | 25-04-2025 09:22 | |||||||
| 29-04-2025 | 4069 | -7,00 | -87,00 | S07W87 | 35 | 34 | f | 0 | 0 | 0 | 0 | 0 | 0 | 0 | 0 | 0 | 0 | 0 | 0 | 22-04-2025 11:24 | ||||||||
| 29-04-2025 | 4065 | -31,00 | -91,00 | S31W91 | 39 | 41 | 20 | Hsx | 1 | 1 | A | f | 1 | 0 | 0 | 0 | 0 | 0 | 0 | 0 | 0 | 5 | 1 | 1 | 1 | 17-04-2025 17:40 | ||
| 29-04-2025 | 4072 | -18,00 | -18,00 | S18W18 | 326 | 326 | 60 | Dai | 4 | 5 | B | f | 0 | 0 | 0 | 0 | 0 | 0 | 0 | 0 | 50 | 10 | 1 | 1 | 23-04-2025 11:15 | |||
| 29-04-2025 | 4077 | -17,00 | 4,00 | S17E04 | 304 | 303 | 10 | Axx | 1 | 1 | A | f | 0 | 0 | 0 | 3 | 0 | 0 | 0 | 0 | 0 | 5 | 1 | 1 | 1 | 25-04-2025 09:24 | ||
| 29-04-2025 | 4078 | 16,00 | -61,00 | N16W61 | 9 | 9 | 20 | Cro | 4 | 4 | B | f | 0 | 2 | 0 | 0 | 2 | 0 | 0 | 0 | 0 | 15 | 1 | 1 | 1 | 28-04-2025 18:04 | ||
| 29-04-2025 | 4076 | 6,00 | 4,00 | N06E04 | 304 | 305 | 80 | Hsx | 2 | 1 | A | f | 0 | 0 | 0 | 0 | 0 | 0 | 0 | 0 | 10 | 1 | 1 | 1 | 25-04-2025 09:23 | |||
| 29-04-2025 | 4079 | 8,00 | 67,00 | N08E67 | 241 | 245 | 560 | Ehi | 14 | 5 | BG | f | 7 | 1 | 0 | 2 | 1 | 0 | 0 | 0 | 0 | 75 | 35 | 5 | 1 | 28-04-2025 18:05 | ||
| 29-04-2025 | 4064 | 11,00 | -100,00 | N11W0* | 48 | 48 | 100 | Dso | 6 | 2 | B | d | 0 | 0 | 0 | 0 | 0 | 0 | 0 | 0 | 0 | 0 | 0 | 0 | 16-04-2025 16:23 | |||
| 29-04-2025 | 4070 | -12,00 | -58,00 | S12W58 | 6 | 5 | 70 | Dso | 9 | 7 | B | f | 3 | 0 | 0 | 4 | 0 | 0 | 0 | 0 | 0 | 35 | 5 | 1 | 1 | 22-04-2025 11:25 | ||
| 28-04-2025 | 4064 | 11,00 | -86,00 | N11W86 | 48 | 47 | 100 | Dso | 6 | 2 | B | f | 0 | 0 | 0 | 0 | 0 | 0 | 0 | 0 | 25 | 5 | 1 | 1 | 16-04-2025 16:23 | |||
| 28-04-2025 | 4067 | -4,00 | -83,00 | S04W83 | 44 | 43 | f | 0 | 0 | 0 | 0 | 0 | 0 | 0 | 0 | 0 | 0 | 0 | 0 | 18-04-2025 10:58 | ||||||||
| 28-04-2025 | 4069 | -7,00 | -72,00 | S07W72 | 34 | 34 | 10 | Axx | 1 | 1 | A | f | 1 | 0 | 0 | 0 | 0 | 0 | 0 | 0 | 0 | 5 | 1 | 1 | 1 | 22-04-2025 11:24 | ||
| 28-04-2025 | 4072 | -19,00 | -5,00 | S19W05 | 326 | 324 | 70 | Dai | 3 | 9 | B | f | 0 | 0 | 0 | 0 | 0 | 0 | 0 | 0 | 50 | 10 | 1 | 1 | 23-04-2025 11:15 | |||
| 28-04-2025 | 4075 | -11,00 | 6,00 | S11E06 | 316 | 315 | f | 0 | 0 | 0 | 1 | 0 | 0 | 0 | 0 | 0 | 0 | 0 | 0 | 0 | 25-04-2025 09:22 | |||||||
| 28-04-2025 | 4079 | 8,00 | 76,00 | N08E76 | 245 | 250 | Hkx | 4 | 2 | A | f | 3 | 0 | 0 | 0 | 0 | 0 | 0 | 0 | 0 | 20 | 5 | 1 | 1 | 28-04-2025 18:05 | |||
| 28-04-2025 | 4077 | -17,00 | 18,00 | S17E18 | 303 | 303 | 20 | Cro | 4 | 3 | B | f | 0 | 0 | 0 | 1 | 0 | 0 | 0 | 0 | 0 | 5 | 1 | 1 | 1 | 25-04-2025 09:24 | ||
| 28-04-2025 | 4068 | -25,00 | -31,00 | S25W31 | 353 | 352 | 10 | Hrx | 4 | 2 | A | f | 0 | 0 | 0 | 0 | 0 | 0 | 0 | 0 | 5 | 1 | 1 | 1 | 21-04-2025 09:13 | |||
| 28-04-2025 | 4073 | 11,00 | -14,00 | N11W14 | 335 | 335 | f | 0 | 0 | 0 | 0 | 0 | 0 | 0 | 0 | 0 | 0 | 0 | 0 | 24-04-2025 11:16 | ||||||||
| 28-04-2025 | 4076 | 6,00 | 16,00 | N06E16 | 305 | 305 | 90 | Hsx | 2 | 1 | A | f | 0 | 0 | 0 | 0 | 0 | 0 | 0 | 0 | 10 | 1 | 1 | 1 | 25-04-2025 09:23 | |||
| 28-04-2025 | 4070 | -12,00 | -44,00 | S12W44 | 5 | 3 | 70 | Dso | 10 | 8 | BG | f | 1 | 0 | 0 | 1 | 0 | 0 | 0 | 0 | 0 | 30 | 5 | 1 | 1 | 22-04-2025 11:25 | ||
| 28-04-2025 | 4065 | -31,00 | -79,00 | S31W79 | 41 | 40 | 30 | Hsx | 1 | 1 | A | f | 0 | 0 | 0 | 0 | 0 | 0 | 0 | 0 | 10 | 1 | 1 | 1 | 17-04-2025 17:40 | |||
| 28-04-2025 | 4066 | -5,00 | -104,00 | S05W0* | 65 | 64 | d | 0 | 0 | 0 | 0 | 0 | 0 | 0 | 0 | 0 | 0 | 0 | 0 | 17-04-2025 17:42 | ||||||||
| 28-04-2025 | 4074 | -20,00 | -101,00 | S20W0* | 62 | 62 | d | 0 | 0 | 0 | 0 | 0 | 0 | 0 | 0 | 0 | 0 | 0 | 0 | 25-04-2025 09:19 | ||||||||
| 28-04-2025 | 4078 | 16,00 | -48,00 | N16W48 | 9 | 10 | Bxo | 3 | 5 | B | f | 2 | 0 | 0 | 1 | 0 | 0 | 0 | 0 | 0 | 5 | 1 | 1 | 1 | 28-04-2025 18:04 | |||
| 27-04-2025 | 4072 | -19,00 | 11,00 | S19E11 | 324 | 323 | 50 | Hsx | 2 | 4 | A | f | 0 | 0 | 0 | 0 | 0 | 0 | 0 | 0 | 10 | 0 | 0 | 0 | 23-04-2025 11:15 | |||
| 27-04-2025 | 4062 | -1,00 | -100,00 | S01W0* | 75 | 73 | 20 | Hsx | 1 | 1 | A | d | 0 | 0 | 0 | 0 | 0 | 0 | 0 | 0 | 0 | 0 | 0 | 0 | 15-04-2025 09:56 | |||
| 27-04-2025 | 4073 | 11,00 | 0,00 | N11W00 | 335 | 336 | 10 | Bxo | 5 | 2 | B | f | 0 | 0 | 0 | 0 | 0 | 0 | 0 | 0 | 10 | 0 | 0 | 0 | 24-04-2025 11:16 | |||
| 27-04-2025 | 4076 | 5,00 | 30,00 | N05E30 | 305 | 303 | 80 | Hsx | 2 | 1 | A | f | 0 | 0 | 0 | 0 | 0 | 0 | 0 | 0 | 10 | 0 | 0 | 0 | 25-04-2025 09:23 | |||
| 27-04-2025 | 4064 | 12,00 | -72,00 | N12W72 | 47 | 47 | 100 | Dso | 6 | 4 | B | f | 2 | 0 | 0 | 1 | 0 | 0 | 0 | 0 | 0 | 25 | 5 | 0 | 0 | 16-04-2025 16:23 | ||
| 27-04-2025 | 4066 | -5,00 | -89,00 | S05W89 | 64 | 62 | f | 0 | 0 | 0 | 0 | 0 | 0 | 0 | 0 | 0 | 0 | 0 | 0 | 17-04-2025 17:42 | ||||||||
| 27-04-2025 | 4074 | -20,00 | -87,00 | S20W87 | 62 | 61 | f | 0 | 0 | 0 | 0 | 0 | 0 | 0 | 0 | 0 | 0 | 0 | 0 | 25-04-2025 09:19 | ||||||||
| 27-04-2025 | 4075 | -11,00 | 20,00 | S11E20 | 315 | 314 | f | 0 | 0 | 0 | 0 | 0 | 0 | 0 | 0 | 0 | 0 | 0 | 0 | 25-04-2025 09:22 | ||||||||
| 27-04-2025 | 4065 | -31,00 | -65,00 | S31W65 | 40 | 42 | 30 | Hsx | 1 | 1 | A | f | 0 | 0 | 0 | 0 | 0 | 0 | 0 | 0 | 10 | 0 | 0 | 0 | 17-04-2025 17:40 | |||
| 27-04-2025 | 4068 | -25,00 | -17,00 | S25W17 | 352 | 353 | 10 | Hrx | 1 | 1 | A | f | 0 | 0 | 0 | 0 | 0 | 0 | 0 | 0 | 5 | 0 | 0 | 0 | 21-04-2025 09:13 | |||
| 27-04-2025 | 4070 | -12,00 | -28,00 | S12W28 | 3 | 2 | 110 | Dso | 10 | 11 | B | f | 1 | 0 | 0 | 1 | 0 | 0 | 0 | 0 | 0 | 30 | 5 | 0 | 0 | 22-04-2025 11:25 | ||
| 27-04-2025 | 4067 | -4,00 | -68,00 | S04W68 | 43 | 42 | f | 0 | 0 | 0 | 0 | 0 | 0 | 0 | 0 | 0 | 0 | 0 | 0 | 18-04-2025 10:58 | ||||||||
| 27-04-2025 | 4069 | -9,00 | -59,00 | S09W59 | 34 | 33 | 10 | Axx | 1 | 1 | A | f | 0 | 0 | 0 | 0 | 0 | 0 | 0 | 0 | 5 | 0 | 0 | 0 | 22-04-2025 11:24 | |||
| 27-04-2025 | 4077 | -16,00 | 32,00 | S16E32 | 303 | 301 | 20 | Hrx | 3 | 4 | A | f | 0 | 0 | 0 | 0 | 0 | 0 | 0 | 0 | 10 | 0 | 0 | 0 | 25-04-2025 09:24 | |||
| 26-04-2025 | 4066 | -5,00 | -74,00 | S05W74 | 62 | 60 | 0 | 0 | 0 | 0 | 0 | 0 | 0 | 0 | 0 | 0 | 0 | 0 | 17-04-2025 17:42 | |||||||||
| 26-04-2025 | 4069 | -9,00 | -45,00 | S09W45 | 33 | 32 | 20 | Cso | 3 | 3 | B | f | 0 | 0 | 0 | 0 | 0 | 0 | 0 | 0 | 20 | 0 | 0 | 0 | 22-04-2025 11:24 | |||
| 26-04-2025 | 4072 | -19,00 | 25,00 | S19E25 | 323 | 323 | 50 | Hsx | 1 | 4 | A | f | 1 | 0 | 0 | 0 | 0 | 0 | 0 | 0 | 0 | 10 | 0 | 0 | 0 | 23-04-2025 11:15 | ||
| 26-04-2025 | 4062 | -1,00 | -85,00 | S01W85 | 73 | 73 | 20 | Hsx | 1 | 1 | A | f | 0 | 0 | 0 | 0 | 0 | 0 | 0 | 0 | 10 | 0 | 0 | 0 | 15-04-2025 09:56 | |||
| 26-04-2025 | 4077 | -17,00 | 47,00 | S17E47 | 301 | 299 | 20 | Cao | 3 | 4 | B | f | 0 | 0 | 0 | 0 | 0 | 0 | 0 | 0 | 25 | 5 | 0 | 0 | 25-04-2025 09:24 | |||
| 26-04-2025 | 4065 | -31,00 | -54,00 | S31W54 | 42 | 42 | 30 | Hsx | 1 | 1 | A | f | 0 | 0 | 0 | 0 | 0 | 0 | 0 | 0 | 10 | 0 | 0 | 0 | 17-04-2025 17:40 | |||
| 26-04-2025 | 4070 | -12,00 | -14,00 | S12W14 | 2 | 1 | 110 | Dsi | 10 | 6 | B | f | 0 | 0 | 0 | 1 | 0 | 0 | 0 | 0 | 0 | 50 | 10 | 0 | 0 | 22-04-2025 11:25 | ||
| 26-04-2025 | 4073 | 11,00 | 13,00 | N11E13 | 336 | 335 | 10 | Bxo | 4 | 32 | B | f | 0 | 0 | 0 | 0 | 0 | 0 | 0 | 0 | 10 | 0 | 0 | 0 | 24-04-2025 11:16 | |||
| 26-04-2025 | 4064 | 12,00 | -59,00 | N12W59 | 47 | 46 | 180 | Dso | 6 | 5 | B | f | 3 | 0 | 0 | 0 | 0 | 0 | 0 | 0 | 0 | 25 | 5 | 0 | 0 | 16-04-2025 16:23 | ||
| 26-04-2025 | 4074 | -20,00 | -73,00 | S20W73 | 61 | 60 | 20 | Cri | 3 | 4 | B | f | 0 | 0 | 0 | 0 | 0 | 0 | 0 | 0 | 35 | 5 | 0 | 0 | 25-04-2025 09:19 | |||
| 26-04-2025 | 4067 | -3,00 | -55,00 | S03W55 | 42 | 43 | f | 0 | 0 | 0 | 0 | 0 | 0 | 0 | 0 | 0 | 0 | 0 | 0 | 18-04-2025 10:58 | ||||||||
| 26-04-2025 | 4068 | -26,00 | -5,00 | S26W05 | 353 | 353 | 10 | Axx | 1 | 1 | A | f | 0 | 0 | 0 | 0 | 0 | 0 | 0 | 0 | 5 | 0 | 0 | 0 | 21-04-2025 09:13 | |||
| 26-04-2025 | 4075 | -11,00 | 34,00 | S11E34 | 314 | 313 | f | 0 | 0 | 0 | 0 | 0 | 0 | 0 | 0 | 1 | 0 | 0 | 0 | 25-04-2025 09:22 | ||||||||
| 26-04-2025 | 4076 | 5,00 | 45,00 | N05E45 | 303 | 302 | 60 | Hsx | 1 | 1 | A | f | 0 | 0 | 0 | 0 | 0 | 0 | 0 | 0 | 10 | 0 | 0 | 0 | 25-04-2025 09:23 | |||
| 25-04-2025 | 4064 | 11,00 | -45,00 | N11W45 | 46 | 46 | 300 | Dki | 9 | 12 | B | f | 0 | 0 | 0 | 0 | 0 | 0 | 0 | 0 | 60 | 15 | 0 | 0 | 16-04-2025 16:23 | |||
| 25-04-2025 | 4065 | -31,00 | -41,00 | S31W41 | 42 | 41 | 40 | Hsx | 1 | 1 | A | f | 0 | 0 | 0 | 0 | 0 | 0 | 0 | 0 | 10 | 0 | 0 | 0 | 17-04-2025 17:40 | |||
| 25-04-2025 | 4067 | -3,00 | -42,00 | S03W42 | 43 | 40 | f | 0 | 0 | 0 | 0 | 0 | 0 | 0 | 0 | 0 | 0 | 0 | 0 | 18-04-2025 10:58 | ||||||||
| 25-04-2025 | 4073 | 12,00 | 26,00 | N12E26 | 335 | 334 | 30 | Dri | 4 | 6 | B | f | 2 | 0 | 0 | 1 | 0 | 0 | 0 | 0 | 0 | 45 | 5 | 0 | 0 | 24-04-2025 11:16 | ||
| 25-04-2025 | 4075 | -11,00 | 48,00 | S11E48 | 313 | 10 | Bxo | 3 | 4 | B | f | 0 | 0 | 0 | 0 | 0 | 0 | 0 | 0 | 10 | 0 | 0 | 0 | 25-04-2025 09:22 | ||||
| 25-04-2025 | 4071 | -13,00 | -113,00 | S13W0* | 114 | 115 | 10 | Bxo | 2 | 3 | B | d | 0 | 0 | 0 | 0 | 0 | 0 | 0 | 0 | 0 | 0 | 0 | 0 | 22-04-2025 16:48 | |||
| 25-04-2025 | 4074 | -20,00 | -59,00 | S20W59 | 60 | 20 | Cri | 3 | 4 | B | f | 0 | 0 | 0 | 0 | 0 | 0 | 0 | 0 | 35 | 5 | 0 | 0 | 25-04-2025 09:19 | ||||
| 25-04-2025 | 4062 | -3,00 | -72,00 | S03W72 | 73 | 70 | 30 | Hsx | 3 | 3 | A | f | 0 | 0 | 0 | 0 | 0 | 0 | 0 | 0 | 10 | 0 | 0 | 0 | 15-04-2025 09:56 | |||
| 25-04-2025 | 4070 | -12,00 | 0,00 | S12W00 | 1 | 2 | 140 | Dai | 6 | 7 | B | f | 0 | 0 | 0 | 0 | 0 | 0 | 0 | 0 | 55 | 10 | 0 | 0 | 22-04-2025 11:25 | |||
| 25-04-2025 | 4066 | -5,00 | -59,00 | S05W59 | 60 | 58 | f | 0 | 0 | 0 | 0 | 0 | 0 | 0 | 0 | 0 | 0 | 0 | 0 | 17-04-2025 17:42 | ||||||||
| 25-04-2025 | 4069 | -9,00 | -31,00 | S09W31 | 32 | 31 | 30 | Dro | 7 | 5 | B | f | 0 | 0 | 0 | 0 | 0 | 0 | 0 | 0 | 20 | 5 | 0 | 0 | 22-04-2025 11:24 | |||
| 25-04-2025 | 4076 | 6,00 | 59,00 | N06E59 | 302 | 80 | Hsx | 2 | 1 | A | f | 0 | 0 | 0 | 0 | 0 | 0 | 0 | 0 | 10 | 0 | 0 | 0 | 25-04-2025 09:23 | ||||
| 25-04-2025 | 4072 | -18,00 | 38,00 | S18E38 | 323 | 322 | 60 | Hsx | 2 | 1 | A | f | 0 | 0 | 0 | 0 | 0 | 0 | 0 | 0 | 10 | 0 | 0 | 0 | 23-04-2025 11:15 | |||
| 25-04-2025 | 4068 | -26,00 | 8,00 | S26E08 | 353 | 352 | 20 | Hax | 3 | 1 | A | f | 0 | 0 | 0 | 0 | 0 | 0 | 0 | 0 | 15 | 0 | 0 | 0 | 21-04-2025 09:13 | |||
| 25-04-2025 | 4077 | -17,00 | 62,00 | S17E62 | 299 | 50 | Dao | 6 | 4 | B | f | 2 | 0 | 0 | 0 | 0 | 0 | 0 | 0 | 0 | 30 | 5 | 0 | 0 | 25-04-2025 09:24 | |||
| 24-04-2025 | 4071 | -13,00 | -99,00 | S13W99 | 115 | 112 | 10 | Bxo | 2 | 3 | B | 0 | 0 | 0 | 0 | 0 | 0 | 0 | 0 | 10 | 0 | 0 | 0 | 22-04-2025 16:48 | ||||
| 24-04-2025 | 4062 | -3,00 | -57,00 | S03W57 | 70 | 71 | 70 | Hax | 3 | 3 | A | f | 0 | 0 | 0 | 0 | 0 | 0 | 0 | 0 | 10 | 1 | 1 | 1 | 15-04-2025 09:56 | |||
| 24-04-2025 | 4064 | 11,00 | -32,00 | N11W32 | 46 | 45 | 200 | Eai | 11 | 12 | B | f | 3 | 0 | 0 | 1 | 0 | 0 | 0 | 0 | 0 | 55 | 15 | 1 | 1 | 16-04-2025 16:23 | ||
| 24-04-2025 | 4069 | -9,00 | -17,00 | S09W17 | 31 | 31 | 40 | Dao | 7 | 5 | B | f | 0 | 0 | 0 | 0 | 0 | 0 | 0 | 0 | 30 | 5 | 1 | 1 | 22-04-2025 11:24 | |||
| 24-04-2025 | 4073 | 12,00 | 40,00 | N12E40 | 334 | 30 | Dri | 4 | 6 | B | f | 0 | 0 | 0 | 0 | 0 | 0 | 0 | 0 | 45 | 5 | 1 | 1 | 24-04-2025 11:16 | ||||
| 24-04-2025 | 4070 | -12,00 | 14,00 | S12E14 | 2 | 2 | 90 | Dai | 6 | 7 | B | f | 1 | 0 | 0 | 1 | 0 | 0 | 0 | 0 | 0 | 55 | 10 | 1 | 1 | 22-04-2025 11:25 | ||
| 24-04-2025 | 4065 | -31,00 | -27,00 | S31W27 | 41 | 41 | 40 | Hsx | 1 | 1 | A | f | 0 | 0 | 0 | 0 | 0 | 0 | 0 | 0 | 10 | 1 | 1 | 1 | 17-04-2025 17:40 | |||
| 24-04-2025 | 4066 | -5,00 | -44,00 | S05W44 | 58 | 59 | 10 | Axx | 1 | 1 | A | f | 0 | 0 | 0 | 0 | 0 | 0 | 0 | 0 | 5 | 1 | 1 | 1 | 17-04-2025 17:42 | |||
| 24-04-2025 | 4068 | -26,00 | 22,00 | S26E22 | 352 | 352 | 50 | Dso | 3 | 2 | B | f | 0 | 0 | 0 | 0 | 0 | 0 | 0 | 0 | 25 | 5 | 1 | 1 | 21-04-2025 09:13 | |||
| 24-04-2025 | 4067 | -3,00 | -27,00 | S03W27 | 40 | 42 | 10 | Axx | 1 | 1 | A | f | 1 | 0 | 0 | 2 | 0 | 0 | 0 | 0 | 0 | 5 | 1 | 1 | 1 | 18-04-2025 10:58 | ||
| 24-04-2025 | 4072 | -18,00 | 52,00 | S18E52 | 322 | 324 | 50 | Hsx | 2 | 1 | A | f | 0 | 0 | 0 | 0 | 0 | 0 | 0 | 0 | 10 | 1 | 1 | 1 | 23-04-2025 11:15 | |||
| 23-04-2025 | 4063 | 5,00 | -94,00 | N05W94 | 122 | 119 | d | 0 | 0 | 0 | 0 | 0 | 0 | 0 | 0 | 0 | 0 | 0 | 0 | 16-04-2025 16:22 | ||||||||
| 23-04-2025 | 4070 | -12,00 | 24,00 | S12E24 | 2 | 2 | 70 | Dai | 7 | 9 | BG | f | 3 | 0 | 0 | 4 | 0 | 0 | 0 | 0 | 0 | 50 | 10 | 1 | 1 | 22-04-2025 11:25 | ||
| 23-04-2025 | 4071 | -13,00 | -89,00 | S13W89 | 112 | 109 | 10 | Bxo | 2 | 3 | B | f | 0 | 0 | 0 | 0 | 0 | 0 | 0 | 0 | 10 | 1 | 1 | 1 | 22-04-2025 16:48 | |||
| 23-04-2025 | 4069 | -8,00 | -5,00 | S08W05 | 31 | 33 | 60 | Dao | 7 | 5 | B | f | 0 | 0 | 0 | 1 | 0 | 0 | 0 | 0 | 0 | 25 | 5 | 1 | 1 | 22-04-2025 11:24 | ||
| 23-04-2025 | 4068 | -26,00 | 35,00 | S26E35 | 352 | 354 | 60 | Dso | 3 | 3 | B | f | 0 | 0 | 0 | 0 | 0 | 0 | 0 | 0 | 20 | 5 | 1 | 1 | 21-04-2025 09:13 | |||
| 23-04-2025 | 4064 | 11,00 | -18,00 | N11W18 | 45 | 47 | 210 | Eai | 11 | 16 | B | f | 2 | 0 | 0 | 4 | 0 | 0 | 0 | 0 | 0 | 60 | 15 | 1 | 1 | 16-04-2025 16:23 | ||
| 23-04-2025 | 4066 | -5,00 | -33,00 | S05W33 | 59 | 60 | f | 0 | 0 | 0 | 0 | 0 | 0 | 0 | 0 | 0 | 0 | 0 | 0 | 17-04-2025 17:42 | ||||||||
| 23-04-2025 | 4067 | -3,00 | -19,00 | S03W19 | 42 | 39 | f | 0 | 0 | 0 | 0 | 0 | 0 | 0 | 0 | 0 | 0 | 0 | 0 | 18-04-2025 10:58 | ||||||||
| 23-04-2025 | 4072 | -18,00 | 62,00 | S18E62 | 324 | 80 | Hsx | 2 | 1 | A | f | 0 | 0 | 0 | 0 | 0 | 0 | 0 | 0 | 10 | 1 | 1 | 1 | 23-04-2025 11:15 | ||||
| 23-04-2025 | 4062 | -3,00 | -45,00 | S03W45 | 71 | 72 | 140 | Dai | 4 | 12 | B | f | 0 | 0 | 0 | 0 | 0 | 0 | 0 | 0 | 50 | 10 | 1 | 1 | 15-04-2025 09:56 | |||
| 23-04-2025 | 4065 | -31,00 | -14,00 | S31W14 | 41 | 43 | 70 | Cso | 3 | 3 | B | f | 0 | 0 | 0 | 0 | 0 | 0 | 0 | 0 | 15 | 1 | 1 | 1 | 17-04-2025 17:40 | |||
| 22-04-2025 | 4065 | -31,00 | -2,00 | S31W02 | 43 | 42 | 70 | Hsx | 2 | 1 | A | f | 0 | 0 | 0 | 1 | 0 | 0 | 0 | 0 | 0 | 5 | 1 | 1 | 1 | 17-04-2025 17:40 | ||
| 22-04-2025 | 4070 | -12,00 | 38,00 | S12E38 | 2 | 40 | Cao | 4 | 4 | B | f | 0 | 0 | 0 | 0 | 0 | 0 | 0 | 0 | 20 | 5 | 1 | 1 | 22-04-2025 11:25 | ||||
| 22-04-2025 | 4063 | 5,00 | -79,00 | N05W79 | 119 | 117 | 10 | Cro | 3 | 2 | B | f | 0 | 1 | 0 | 0 | 0 | 0 | 0 | 0 | 0 | 15 | 1 | 1 | 1 | 16-04-2025 16:22 | ||
| 22-04-2025 | 4064 | 11,00 | -7,00 | N11W07 | 47 | 47 | 250 | Ehi | 11 | 18 | B | f | 0 | 0 | 0 | 1 | 0 | 0 | 0 | 0 | 0 | 60 | 10 | 1 | 1 | 16-04-2025 16:23 | ||
| 22-04-2025 | 4069 | -8,00 | 7,00 | S08E07 | 33 | 20 | Cao | 3 | 4 | B | f | 0 | 0 | 0 | 1 | 0 | 0 | 0 | 0 | 0 | 20 | 5 | 1 | 1 | 22-04-2025 11:24 | |||
| 22-04-2025 | 4060 | 8,00 | -96,00 | N08W96 | 137 | 136 | d | 0 | 0 | 0 | 0 | 0 | 0 | 0 | 0 | 0 | 0 | 0 | 0 | 0 | 10-04-2025 09:14 | |||||||
| 22-04-2025 | 4062 | -2,00 | -32,00 | S02W32 | 72 | 71 | 130 | Dai | 6 | 15 | B | f | 1 | 0 | 0 | 1 | 0 | 0 | 0 | 0 | 0 | 45 | 10 | 1 | 1 | 15-04-2025 09:56 | ||
| 22-04-2025 | 4068 | -26,00 | 46,00 | S26E46 | 354 | 352 | 70 | Dso | 3 | 3 | B | f | 0 | 0 | 0 | 1 | 0 | 0 | 0 | 0 | 0 | 20 | 1 | 1 | 1 | 21-04-2025 09:13 | ||
| 22-04-2025 | 4071 | -13,00 | -69,00 | S13W69 | 109 | 10 | Bxo | 5 | 3 | B | f | 0 | 0 | 0 | 0 | 0 | 0 | 0 | 0 | 10 | 1 | 1 | 1 | 22-04-2025 16:48 | ||||
| 22-04-2025 | 4067 | -3,00 | 1,00 | S03E01 | 39 | 40 | 10 | Bxo | 9 | 2 | B | f | 0 | 0 | 0 | 0 | 0 | 0 | 0 | 0 | 5 | 1 | 1 | 1 | 18-04-2025 10:58 | |||
| 22-04-2025 | 4066 | -5,00 | -19,00 | S05W19 | 60 | 58 | f | 0 | 0 | 0 | 0 | 0 | 0 | 0 | 0 | 0 | 0 | 0 | 0 | 17-04-2025 17:42 | ||||||||
| 21-04-2025 | 4064 | 11,00 | 7,00 | N11E07 | 47 | 49 | 340 | Eki | 11 | 19 | B | f | 1 | 0 | 0 | 1 | 0 | 0 | 0 | 0 | 0 | 65 | 15 | 1 | 1 | 16-04-2025 16:23 | ||
| 21-04-2025 | 4063 | 4,00 | -63,00 | N04W63 | 117 | 116 | 30 | Cro | 6 | 9 | B | f | 1 | 0 | 0 | 3 | 0 | 0 | 0 | 0 | 0 | 25 | 5 | 1 | 1 | 16-04-2025 16:22 | ||
| 21-04-2025 | 4068 | -26,00 | 62,00 | S26E62 | 352 | 347 | 60 | Dso | 4 | 3 | B | f | 0 | 0 | 0 | 0 | 0 | 0 | 0 | 0 | 40 | 10 | 1 | 1 | 21-04-2025 09:13 | |||
| 21-04-2025 | 4062 | -3,00 | -17,00 | S03W17 | 71 | 71 | 280 | Dki | 6 | 15 | B | f | 0 | 1 | 0 | 0 | 1 | 0 | 0 | 0 | 0 | 60 | 15 | 1 | 1 | 15-04-2025 09:56 | ||
| 21-04-2025 | 4067 | -3,00 | 14,00 | S03E14 | 40 | 39 | 20 | Cro | 9 | 2 | B | f | 0 | 0 | 0 | 0 | 0 | 0 | 0 | 0 | 10 | 1 | 1 | 1 | 18-04-2025 10:58 | |||
| 21-04-2025 | 4060 | 8,00 | -82,00 | N08W82 | 136 | 136 | 20 | Hrx | 2 | 2 | A | f | 0 | 0 | 0 | 0 | 0 | 0 | 0 | 0 | 5 | 1 | 1 | 1 | 10-04-2025 09:14 | |||
| 21-04-2025 | 4066 | -5,00 | -4,00 | S05W04 | 58 | 59 | 10 | Axx | 2 | 4 | A | f | 0 | 0 | 0 | 0 | 0 | 0 | 0 | 0 | 0 | 5 | 1 | 1 | 1 | 17-04-2025 17:42 | ||
| 21-04-2025 | 4065 | -31,00 | 12,00 | S31E12 | 42 | 42 | 70 | Cso | 4 | 3 | B | f | 0 | 0 | 0 | 0 | 0 | 0 | 0 | 0 | 20 | 1 | 1 | 1 | 17-04-2025 17:40 | |||
| 20-04-2025 | 4064 | 11,00 | 18,00 | N11E18 | 49 | 48 | 330 | Dki | 8 | 10 | B | f | 1 | 0 | 0 | 1 | 0 | 0 | 0 | 0 | 0 | 65 | 15 | 5 | 0 | 16-04-2025 16:23 | ||
| 20-04-2025 | 4066 | -4,00 | 8,00 | S04E08 | 59 | 59 | 20 | Cso | 2 | 4 | B | f | 0 | 0 | 0 | 0 | 0 | 0 | 0 | 0 | 15 | 0 | 0 | 0 | 17-04-2025 17:42 | |||
| 20-04-2025 | 4059 | 13,00 | -99,00 | N13W99 | 166 | 165 | d | 0 | 0 | 0 | 0 | 0 | 0 | 0 | 0 | 0 | 0 | 0 | 0 | 09-04-2025 17:06 | ||||||||
| 20-04-2025 | 4060 | 8,00 | -69,00 | N08W69 | 136 | 135 | 40 | Cao | 2 | 3 | B | f | 0 | 0 | 0 | 1 | 0 | 0 | 0 | 0 | 0 | 25 | 5 | 0 | 0 | 10-04-2025 09:14 | ||
| 20-04-2025 | 4065 | -29,00 | 25,00 | S29E25 | 42 | 44 | 80 | Dao | 3 | 4 | B | f | 1 | 0 | 0 | 0 | 0 | 0 | 0 | 0 | 0 | 25 | 5 | 0 | 0 | 17-04-2025 17:40 | ||
| 20-04-2025 | 4062 | -3,00 | -4,00 | S03W04 | 71 | 69 | 270 | Dki | 5 | 11 | BG | f | 0 | 0 | 0 | 0 | 0 | 0 | 0 | 0 | 65 | 15 | 5 | 0 | 15-04-2025 09:56 | |||
| 20-04-2025 | 4067 | -3,00 | 28,00 | S03E28 | 39 | 38 | 40 | Cso | 6 | 3 | B | f | 0 | 0 | 0 | 0 | 0 | 0 | 0 | 0 | 15 | 0 | 0 | 0 | 18-04-2025 10:58 | |||
| 20-04-2025 | 4063 | 4,00 | -49,00 | N04W49 | 116 | 115 | 10 | Bxo | 3 | 3 | B | f | 1 | 0 | 0 | 1 | 0 | 0 | 0 | 0 | 0 | 10 | 0 | 0 | 0 | 16-04-2025 16:22 | ||
| 20-04-2025 | 4068 | -6,00 | 82,00 | S06E82 | 347 | 1 | 1 | 0 | 0 | 0 | 0 | 0 | 0 | 0 | 0 | 0 | 0 | 0 | 21-04-2025 09:13 | |||||||||
| 19-04-2025 | 4063 | 5,00 | -35,00 | N05W35 | 115 | 113 | 10 | Bxo | 4 | 3 | B | 0 | 0 | 0 | 1 | 0 | 0 | 0 | 0 | 0 | 0 | 0 | 0 | 0 | 16-04-2025 16:22 | |||
| 19-04-2025 | 4056 | -7,00 | -102,00 | S07W0* | 182 | 179 | 30 | Hrx | 1 | 1 | A | d | 0 | 0 | 0 | 0 | 0 | 0 | 0 | 0 | 0 | 0 | 0 | 0 | 06-04-2025 09:49 | |||
| 19-04-2025 | 4066 | -4,00 | 21,00 | S04E21 | 59 | 59 | 20 | Cro | 5 | 5 | B | f | 0 | 0 | 0 | 0 | 0 | 0 | 0 | 0 | 15 | 1 | 0 | 0 | 17-04-2025 17:42 | |||
| 19-04-2025 | 4059 | 13,00 | -85,00 | N13W85 | 165 | 165 | f | 0 | 0 | 0 | 0 | 0 | 0 | 0 | 0 | 0 | 0 | 0 | 0 | 09-04-2025 17:06 | ||||||||
| 19-04-2025 | 4061 | 18,00 | -101,00 | N18W0* | 181 | 181 | d | 0 | 0 | 0 | 0 | 0 | 0 | 0 | 0 | 0 | 0 | 0 | 0 | 11-04-2025 16:21 | ||||||||
| 19-04-2025 | 4064 | 11,00 | 32,00 | N11E32 | 48 | 47 | 350 | Dki | 9 | 9 | B | f | 0 | 0 | 0 | 0 | 0 | 0 | 0 | 0 | 65 | 15 | 5 | 0 | 16-04-2025 16:23 | |||
| 19-04-2025 | 4067 | -3,00 | 42,00 | S03E42 | 38 | 38 | 40 | Cso | 6 | 5 | B | f | 0 | 0 | 0 | 0 | 0 | 0 | 0 | 0 | 15 | 0 | 0 | 0 | 18-04-2025 10:58 | |||
| 19-04-2025 | 4060 | 7,00 | -55,00 | N07W55 | 135 | 135 | 70 | Cao | 4 | 4 | B | f | 1 | 0 | 0 | 3 | 0 | 0 | 0 | 0 | 0 | 25 | 5 | 0 | 0 | 10-04-2025 09:14 | ||
| 19-04-2025 | 4062 | -3,00 | 11,00 | S03E11 | 69 | 69 | 280 | Dki | 6 | 12 | BG | f | 0 | 0 | 0 | 0 | 0 | 0 | 0 | 0 | 65 | 15 | 5 | 0 | 15-04-2025 09:56 | |||
| 19-04-2025 | 4065 | -30,00 | 36,00 | S30E36 | 44 | 45 | 70 | Dso | 3 | 6 | B | f | 1 | 0 | 0 | 1 | 0 | 0 | 0 | 0 | 0 | 25 | 5 | 0 | 0 | 17-04-2025 17:40 | ||
| 18-04-2025 | 4062 | -3,00 | 24,00 | S03E24 | 69 | 69 | 300 | Dki | 7 | 13 | BG | f | 1 | 0 | 0 | 1 | 0 | 0 | 0 | 0 | 0 | 60 | 15 | 5 | 1 | 15-04-2025 09:56 | ||
| 18-04-2025 | 4063 | 6,00 | -19,00 | N06W19 | 113 | 111 | f | 0 | 0 | 0 | 0 | 0 | 0 | 0 | 0 | 0 | 0 | 0 | 0 | 16-04-2025 16:22 | ||||||||
| 18-04-2025 | 4056 | -7,00 | -87,00 | S07W87 | 179 | 181 | 30 | Hrx | 1 | 1 | A | f | 0 | 0 | 0 | 0 | 0 | 0 | 0 | 0 | 10 | 1 | 1 | 1 | 06-04-2025 09:49 | |||
| 18-04-2025 | 4064 | 11,00 | 45,00 | N11E45 | 47 | 47 | 350 | Dki | 9 | 9 | B | f | 2 | 0 | 0 | 0 | 0 | 0 | 0 | 0 | 0 | 60 | 15 | 1 | 1 | 16-04-2025 16:23 | ||
| 18-04-2025 | 4059 | 13,00 | -71,00 | N13W71 | 165 | 164 | f | 0 | 0 | 0 | 0 | 0 | 0 | 0 | 0 | 0 | 0 | 0 | 0 | 09-04-2025 17:06 | ||||||||
| 18-04-2025 | 4060 | 8,00 | -42,00 | N08W42 | 135 | 138 | 80 | Cao | 4 | 5 | B | f | 1 | 0 | 0 | 0 | 0 | 0 | 0 | 0 | 0 | 25 | 5 | 1 | 1 | 10-04-2025 09:14 | ||
| 18-04-2025 | 4061 | 18,00 | -87,00 | N18W87 | 181 | 180 | f | 0 | 0 | 0 | 0 | 0 | 0 | 0 | 0 | 0 | 0 | 0 | 0 | 11-04-2025 16:21 | ||||||||
| 18-04-2025 | 4066 | -4,00 | 33,00 | S04E33 | 59 | 58 | 30 | Cao | 7 | 7 | B | f | 1 | 0 | 0 | 0 | 0 | 0 | 0 | 0 | 0 | 25 | 5 | 1 | 1 | 17-04-2025 17:42 | ||
| 18-04-2025 | 4057 | 9,00 | -96,00 | N09W96 | 190 | 189 | d | 0 | 0 | 0 | 0 | 0 | 0 | 0 | 0 | 0 | 0 | 0 | 0 | 07-04-2025 17:27 | ||||||||
| 18-04-2025 | 4065 | -30,00 | 47,00 | S30E47 | 45 | 44 | 30 | Hsx | 1 | 1 | A | f | 0 | 0 | 0 | 0 | 0 | 0 | 0 | 0 | 10 | 1 | 1 | 1 | 17-04-2025 17:40 | |||
| 18-04-2025 | 4067 | -2,00 | 55,00 | S02E55 | 38 | 50 | Cso | 6 | 7 | B | f | 0 | 0 | 0 | 0 | 0 | 0 | 0 | 0 | 15 | 1 | 1 | 1 | 18-04-2025 10:58 | ||||
| 17-04-2025 | 4057 | 9,00 | -82,00 | N09W82 | 189 | 188 | f | 0 | 0 | 0 | 0 | 0 | 0 | 0 | 0 | 0 | 0 | 0 | 0 | 07-04-2025 17:27 | ||||||||
| 17-04-2025 | 4062 | -3,00 | 38,00 | S03E38 | 69 | 68 | 280 | Dki | 5 | 18 | BG | f | 3 | 0 | 0 | 1 | 0 | 0 | 0 | 0 | 0 | 70 | 35 | 5 | 1 | 15-04-2025 09:56 | ||
| 17-04-2025 | 4066 | -5,00 | 49,00 | S05E49 | 58 | 40 | Cai | 6 | 9 | B | f | 1 | 0 | 0 | 0 | 0 | 0 | 0 | 0 | 0 | 35 | 10 | 1 | 1 | 17-04-2025 17:42 | |||
| 17-04-2025 | 4056 | -7,00 | -74,00 | S07W74 | 181 | 181 | 30 | Cso | 3 | 2 | B | f | 0 | 0 | 0 | 0 | 0 | 0 | 0 | 0 | 10 | 1 | 1 | 1 | 06-04-2025 09:49 | |||
| 17-04-2025 | 4064 | 11,00 | 60,00 | N11E60 | 47 | 45 | 200 | Dai | 8 | 8 | B | f | 1 | 0 | 0 | 0 | 0 | 0 | 0 | 0 | 0 | 60 | 20 | 1 | 1 | 16-04-2025 16:23 | ||
| 17-04-2025 | 4061 | 18,00 | -73,00 | N18W73 | 180 | 179 | f | 0 | 0 | 0 | 0 | 0 | 0 | 0 | 0 | 0 | 0 | 0 | 0 | 11-04-2025 16:21 | ||||||||
| 17-04-2025 | 4060 | 8,00 | -31,00 | N08W31 | 138 | 138 | 120 | Cao | 8 | 8 | BD | f | 1 | 0 | 0 | 0 | 0 | 0 | 0 | 0 | 0 | 25 | 5 | 1 | 1 | 10-04-2025 09:14 | ||
| 17-04-2025 | 4063 | 5,00 | -4,00 | N05W04 | 111 | 111 | 10 | Bxo | 4 | 2 | B | f | 0 | 0 | 0 | 0 | 0 | 0 | 0 | 0 | 5 | 1 | 1 | 1 | 16-04-2025 16:22 | |||
| 17-04-2025 | 4059 | 13,00 | -57,00 | N13W57 | 164 | 163 | f | 0 | 0 | 0 | 0 | 0 | 0 | 0 | 0 | 0 | 0 | 0 | 0 | 09-04-2025 17:06 | ||||||||
| 17-04-2025 | 4065 | -30,00 | 63,00 | S30E63 | 44 | 30 | Hsx | 2 | 1 | A | f | 0 | 0 | 0 | 0 | 0 | 0 | 0 | 0 | 5 | 1 | 1 | 1 | 17-04-2025 17:40 | ||||
| 16-04-2025 | 4056 | -7,00 | -62,00 | S07W62 | 181 | 180 | 20 | Hsx | 1 | 1 | A | f | 0 | 0 | 0 | 0 | 0 | 0 | 0 | 0 | 5 | 1 | 1 | 1 | 06-04-2025 09:49 | |||
| 16-04-2025 | 4059 | 13,00 | -43,00 | N13W43 | 163 | 162 | f | 0 | 0 | 0 | 0 | 0 | 0 | 0 | 0 | 0 | 0 | 0 | 0 | 09-04-2025 17:06 | ||||||||
| 16-04-2025 | 4060 | 8,00 | -19,00 | N08W19 | 138 | 135 | 140 | Dai | 8 | 11 | BG | f | 0 | 0 | 0 | 0 | 0 | 0 | 0 | 0 | 50 | 10 | 1 | 1 | 10-04-2025 09:14 | |||
| 16-04-2025 | 4063 | 5,00 | 8,00 | N05E08 | 111 | 10 | Bxo | 4 | 2 | B | f | 0 | 0 | 0 | 0 | 0 | 0 | 0 | 0 | 10 | 1 | 1 | 1 | 16-04-2025 16:22 | ||||
| 16-04-2025 | 4062 | -2,00 | 53,00 | S02E53 | 68 | 71 | 250 | Dko | 7 | 3 | BG | f | 2 | 0 | 0 | 1 | 0 | 0 | 0 | 0 | 0 | 40 | 15 | 5 | 1 | 15-04-2025 09:56 | ||
| 16-04-2025 | 4064 | -8,00 | 74,00 | S08E74 | 45 | 80 | Dao | 7 | 3 | B | f | 0 | 0 | 0 | 0 | 0 | 0 | 0 | 0 | 30 | 5 | 1 | 1 | 16-04-2025 16:23 | ||||
| 16-04-2025 | 4057 | 9,00 | -68,00 | N09W68 | 188 | 187 | f | 0 | 0 | 0 | 0 | 0 | 0 | 0 | 0 | 0 | 0 | 0 | 0 | 07-04-2025 17:27 | ||||||||
| 16-04-2025 | 4061 | 18,00 | -59,00 | N18W59 | 179 | 177 | f | 0 | 0 | 0 | 0 | 0 | 0 | 0 | 0 | 0 | 0 | 0 | 0 | 11-04-2025 16:21 | ||||||||
| 15-04-2025 | 4058 | 16,00 | -104,00 | N16W0* | 237 | 236 | 40 | Cao | 3 | 7 | B | d | 0 | 0 | 0 | 0 | 0 | 0 | 0 | 0 | 0 | 0 | 0 | 0 | 09-04-2025 08:53 | |||
| 15-04-2025 | 4059 | 13,00 | -29,00 | N13W29 | 162 | 161 | f | 0 | 0 | 0 | 0 | 0 | 0 | 0 | 0 | 0 | 0 | 0 | 0 | 09-04-2025 17:06 | ||||||||
| 15-04-2025 | 4055 | 7,00 | -107,00 | N07W0* | 240 | 237 | 820 | Ekc | 13 | 14 | BGD | d | 2 | 0 | 0 | 0 | 0 | 0 | 0 | 0 | 0 | 0 | 0 | 0 | 0 | 05-04-2025 16:29 | ||
| 15-04-2025 | 4057 | 9,00 | -54,00 | N09W54 | 187 | 186 | f | 0 | 0 | 0 | 0 | 0 | 0 | 0 | 0 | 0 | 0 | 0 | 0 | 07-04-2025 17:27 | ||||||||
| 15-04-2025 | 4060 | 8,00 | -3,00 | N08W03 | 135 | 138 | 180 | Dai | 9 | 14 | BG | f | 0 | 0 | 0 | 2 | 0 | 0 | 0 | 0 | 0 | 50 | 10 | 1 | 1 | 10-04-2025 09:14 | ||
| 15-04-2025 | 4062 | -2,00 | 61,00 | S02E61 | 71 | 180 | Dao | 4 | 2 | B | f | 1 | 0 | 0 | 0 | 0 | 0 | 0 | 0 | 0 | 30 | 5 | 1 | 1 | 15-04-2025 09:56 | |||
| 15-04-2025 | 4056 | -9,00 | -48,00 | S09W48 | 180 | 181 | 40 | Hsx | 1 | 1 | A | f | 0 | 0 | 0 | 0 | 0 | 0 | 0 | 0 | 10 | 1 | 1 | 1 | 06-04-2025 09:49 | |||
| 15-04-2025 | 4061 | 18,00 | -45,00 | N18W45 | 177 | 175 | 10 | Axx | 1 | 1 | A | f | 0 | 0 | 0 | 0 | 0 | 0 | 0 | 0 | 5 | 1 | 1 | 1 | 11-04-2025 16:21 | |||
| 14-04-2025 | 4057 | 9,00 | -40,00 | N09W40 | 186 | 186 | 0 | 0 | 0 | 0 | 0 | 0 | 0 | 0 | 0 | 0 | 0 | 0 | 07-04-2025 17:27 | |||||||||
| 14-04-2025 | 4060 | 8,00 | 7,00 | N08E07 | 138 | 139 | 140 | Dai | 8 | 12 | BG | f | 0 | 0 | 0 | 0 | 0 | 0 | 0 | 0 | 55 | 15 | 1 | 1 | 10-04-2025 09:14 | |||
| 14-04-2025 | 4056 | -9,00 | -36,00 | S09W36 | 181 | 184 | 60 | Hsx | 2 | 1 | A | f | 0 | 0 | 0 | 0 | 0 | 0 | 0 | 0 | 10 | 1 | 1 | 1 | 06-04-2025 09:49 | |||
| 14-04-2025 | 4055 | 7,00 | -92,00 | N07W92 | 237 | 235 | 820 | Ekc | 13 | 14 | BGD | f | 8 | 2 | 0 | 1 | 0 | 0 | 0 | 0 | 0 | 95 | 80 | 15 | 10 | 05-04-2025 16:29 | ||
| 14-04-2025 | 4058 | 16,00 | -90,00 | N16W90 | 236 | 239 | 40 | Cao | 3 | 7 | B | f | 0 | 0 | 0 | 0 | 0 | 0 | 0 | 0 | 25 | 5 | 1 | 1 | 09-04-2025 08:53 | |||
| 14-04-2025 | 4061 | 18,00 | -29,00 | N18W29 | 175 | 175 | 10 | Bxo | 3 | 2 | B | f | 0 | 0 | 0 | 0 | 0 | 0 | 0 | 0 | 10 | 1 | 1 | 1 | 11-04-2025 16:21 | |||
| 14-04-2025 | 4059 | 13,00 | -15,00 | N13W15 | 161 | 161 | 0 | 0 | 0 | 0 | 0 | 0 | 0 | 0 | 0 | 0 | 0 | 0 | 09-04-2025 17:06 | |||||||||
| 13-04-2025 | 4058 | 17,00 | -79,00 | N17W79 | 239 | 238 | 50 | Cao | 2 | 4 | B | f | 0 | 0 | 0 | 0 | 0 | 0 | 0 | 0 | 20 | 5 | 1 | 1 | 09-04-2025 08:53 | |||
| 13-04-2025 | 4060 | 9,00 | 21,00 | N09E21 | 139 | 139 | 140 | Dao | 7 | 6 | BG | f | 1 | 0 | 0 | 0 | 0 | 0 | 0 | 0 | 0 | 30 | 5 | 1 | 1 | 10-04-2025 09:14 | ||
| 13-04-2025 | 4054 | -15,00 | -98,00 | S15W98 | 258 | 257 | 90 | Cso | 4 | 4 | B | d | 1 | 0 | 0 | 0 | 0 | 0 | 0 | 0 | 0 | 0 | 0 | 0 | 0 | 05-04-2025 16:29 | ||
| 13-04-2025 | 4057 | 9,00 | -26,00 | N09W26 | 186 | 185 | f | 0 | 0 | 0 | 0 | 0 | 0 | 0 | 0 | 0 | 0 | 0 | 0 | 07-04-2025 17:27 | ||||||||
| 13-04-2025 | 4059 | 13,00 | -1,00 | N13W01 | 161 | 160 | f | 0 | 0 | 0 | 0 | 0 | 0 | 0 | 0 | 0 | 0 | 0 | 0 | 09-04-2025 17:06 | ||||||||
| 13-04-2025 | 4055 | 7,00 | -75,00 | N07W75 | 235 | 237 | 820 | Ekc | 13 | 14 | BGD | f | 6 | 10 | 0 | 3 | 4 | 0 | 0 | 0 | 0 | 95 | 80 | 15 | 10 | 05-04-2025 16:29 | ||
| 13-04-2025 | 4056 | -8,00 | -24,00 | S08W24 | 184 | 182 | 60 | Hsx | 2 | 1 | A | f | 0 | 0 | 0 | 0 | 0 | 0 | 0 | 0 | 10 | 1 | 1 | 1 | 06-04-2025 09:49 | |||
| 13-04-2025 | 4061 | 19,00 | -15,00 | N19W15 | 175 | 177 | 30 | Cso | 4 | 5 | B | f | 0 | 0 | 0 | 0 | 0 | 0 | 0 | 0 | 15 | 1 | 1 | 1 | 11-04-2025 16:21 | |||
| 12-04-2025 | 4056 | -8,00 | -9,00 | S08W09 | 182 | 182 | 60 | Cso | 2 | 3 | B | f | 0 | 0 | 0 | 0 | 0 | 0 | 0 | 0 | 15 | 1 | 1 | 1 | 06-04-2025 09:49 | |||
| 12-04-2025 | 4057 | 9,00 | -12,00 | N09W12 | 185 | 186 | f | 0 | 0 | 0 | 0 | 0 | 0 | 0 | 0 | 0 | 0 | 0 | 0 | 07-04-2025 17:27 | ||||||||
| 12-04-2025 | 4059 | 13,00 | 13,00 | N13E13 | 160 | 159 | f | 0 | 0 | 0 | 0 | 0 | 0 | 0 | 0 | 0 | 0 | 0 | 0 | 09-04-2025 17:06 | ||||||||
| 12-04-2025 | 4061 | 17,00 | -4,00 | N17W04 | 177 | 176 | 20 | Dso | 3 | 5 | B | f | 0 | 0 | 0 | 0 | 0 | 0 | 0 | 0 | 20 | 5 | 1 | 1 | 11-04-2025 16:21 | |||
| 12-04-2025 | 4048 | -18,00 | -107,00 | S18W0* | 280 | 279 | 30 | Cao | 10 | 2 | B | d | 0 | 0 | 0 | 0 | 0 | 0 | 0 | 0 | 0 | 0 | 0 | 0 | 29-03-2025 15:55 | |||
| 12-04-2025 | 4058 | 13,00 | -65,00 | N13W65 | 238 | 239 | 70 | Dao | 6 | 7 | B | f | 0 | 0 | 0 | 0 | 0 | 0 | 0 | 0 | 30 | 5 | 1 | 1 | 09-04-2025 08:53 | |||
| 12-04-2025 | 4060 | 9,00 | 34,00 | N09E34 | 139 | 136 | 130 | Dso | 4 | 7 | B | f | 1 | 0 | 0 | 2 | 0 | 0 | 0 | 0 | 0 | 30 | 5 | 1 | 1 | 10-04-2025 09:14 | ||
| 12-04-2025 | 4055 | 4,00 | -64,00 | N04W64 | 237 | 237 | 740 | Ekc | 12 | 17 | BGD | f | 8 | 7 | 0 | 6 | 2 | 0 | 0 | 0 | 0 | 95 | 55 | 15 | 5 | 05-04-2025 16:29 | ||
| 12-04-2025 | 4054 | -15,00 | -84,00 | S15W84 | 257 | 256 | 90 | Cso | 4 | 4 | B | f | 1 | 0 | 0 | 0 | 1 | 0 | 0 | 0 | 0 | 15 | 1 | 1 | 1 | 05-04-2025 16:29 | ||
| 11-04-2025 | 4059 | 13,00 | 27,00 | N13E27 | 159 | 160 | 10 | Bxo | 3 | 2 | B | f | 0 | 0 | 0 | 0 | 0 | 0 | 0 | 0 | 10 | 1 | 1 | 1 | 09-04-2025 17:06 | |||
| 11-04-2025 | 4055 | 8,00 | -51,00 | N08W51 | 237 | 235 | 360 | Dkc | 11 | 15 | BGD | f | 9 | 2 | 0 | 17 | 1 | 0 | 0 | 0 | 0 | 80 | 35 | 5 | 5 | 05-04-2025 16:29 | ||
| 11-04-2025 | 4058 | 17,00 | -53,00 | N17W53 | 239 | 239 | 60 | Cso | 8 | 7 | B | f | 0 | 0 | 0 | 0 | 0 | 0 | 0 | 0 | 15 | 1 | 1 | 1 | 09-04-2025 08:53 | |||
| 11-04-2025 | 4048 | -18,00 | -93,00 | S18W93 | 279 | 278 | 30 | Cao | 10 | 2 | B | f | 0 | 0 | 0 | 0 | 0 | 0 | 0 | 0 | 20 | 5 | 1 | 1 | 29-03-2025 15:55 | |||
| 11-04-2025 | 4054 | -14,00 | -70,00 | S14W70 | 256 | 256 | 100 | Dso | 7 | 6 | B | f | 0 | 0 | 0 | 0 | 0 | 0 | 0 | 0 | 20 | 5 | 1 | 1 | 05-04-2025 16:29 | |||
| 11-04-2025 | 4056 | -6,00 | 4,00 | S06E04 | 182 | 182 | 50 | Hsx | 2 | 1 | A | f | 0 | 0 | 0 | 0 | 0 | 0 | 0 | 0 | 10 | 1 | 1 | 1 | 06-04-2025 09:49 | |||
| 11-04-2025 | 4061 | 17,00 | 10,00 | N17E10 | 176 | 10 | Bxo | 3 | 3 | B | f | 0 | 0 | 0 | 0 | 0 | 0 | 0 | 0 | 5 | 1 | 1 | 1 | 11-04-2025 16:21 | ||||
| 11-04-2025 | 4057 | 9,00 | 0,00 | N09W00 | 186 | 186 | f | 0 | 0 | 0 | 0 | 0 | 0 | 0 | 0 | 0 | 0 | 0 | 0 | 07-04-2025 17:27 | ||||||||
| 11-04-2025 | 4060 | 7,00 | 50,00 | N07E50 | 136 | 142 | 140 | Cao | 6 | 4 | B | f | 0 | 0 | 0 | 2 | 0 | 0 | 0 | 0 | 0 | 30 | 5 | 1 | 1 | 10-04-2025 09:14 | ||
| 10-04-2025 | 4049 | -31,00 | -104,00 | S31W0* | 303 | 302 | d | 0 | 0 | 0 | 0 | 0 | 0 | 0 | 0 | 0 | 0 | 0 | 0 | 31-03-2025 07:29 | ||||||||
| 10-04-2025 | 4055 | 8,00 | -36,00 | N08W36 | 235 | 234 | 120 | Dai | 8 | 14 | BG | f | 3 | 0 | 0 | 6 | 0 | 0 | 0 | 0 | 0 | 50 | 10 | 1 | 1 | 05-04-2025 16:29 | ||
| 10-04-2025 | 4060 | 7,00 | 57,00 | N07E57 | 142 | 100 | Dao | 6 | 2 | B | f | 2 | 0 | 0 | 0 | 0 | 0 | 0 | 0 | 0 | 25 | 5 | 1 | 1 | 10-04-2025 09:14 | |||
| 10-04-2025 | 4053 | -9,00 | -103,00 | S09W0* | 302 | 301 | d | 0 | 0 | 0 | 0 | 0 | 0 | 0 | 0 | 0 | 0 | 0 | 0 | 04-04-2025 16:52 | ||||||||
| 10-04-2025 | 4058 | 18,00 | -40,00 | N18W40 | 239 | 237 | 50 | Dao | 8 | 8 | B | f | 0 | 0 | 0 | 0 | 0 | 0 | 0 | 0 | 25 | 5 | 1 | 1 | 09-04-2025 08:53 | |||
| 10-04-2025 | 4059 | 11,00 | 39,00 | N11E39 | 160 | 157 | 10 | Cro | 1 | 1 | B | f | 0 | 0 | 0 | 0 | 0 | 0 | 0 | 0 | 15 | 1 | 1 | 1 | 09-04-2025 17:06 | |||
| 10-04-2025 | 4054 | -12,00 | -57,00 | S12W57 | 256 | 256 | 150 | Dso | 8 | 4 | B | f | 0 | 0 | 0 | 0 | 0 | 0 | 0 | 0 | 20 | 5 | 1 | 1 | 05-04-2025 16:29 | |||
| 10-04-2025 | 4057 | 8,00 | 13,00 | N08E13 | 186 | 185 | f | 0 | 0 | 0 | 0 | 0 | 0 | 0 | 0 | 5 | 1 | 1 | 1 | 07-04-2025 17:27 | ||||||||
| 10-04-2025 | 4046 | 7,00 | -107,00 | N07W0* | 306 | 304 | 110 | Hsx | 3 | 1 | A | d | 0 | 0 | 0 | 0 | 0 | 0 | 0 | 0 | 0 | 0 | 0 | 0 | 28-03-2025 09:20 | |||
| 10-04-2025 | 4048 | -16,00 | -79,00 | S16W79 | 278 | 279 | 180 | Fao | 20 | 12 | B | f | 0 | 0 | 0 | 0 | 0 | 0 | 0 | 0 | 50 | 15 | 1 | 1 | 29-03-2025 15:55 | |||
| 10-04-2025 | 4056 | -7,00 | 17,00 | S07E17 | 182 | 181 | 70 | Hsx | 2 | 1 | A | f | 0 | 0 | 0 | 0 | 0 | 0 | 0 | 0 | 10 | 1 | 1 | 1 | 06-04-2025 09:49 | |||
| 09-04-2025 | 4050 | 28,00 | -94,00 | N28W94 | 306 | 306 | d | 0 | 0 | 0 | 0 | 0 | 0 | 0 | 0 | 0 | 0 | 0 | 0 | 02-04-2025 15:33 | ||||||||
| 09-04-2025 | 4053 | -9,00 | -89,00 | S09W89 | 301 | 301 | f | 0 | 0 | 0 | 0 | 0 | 0 | 0 | 0 | 0 | 0 | 0 | 0 | 04-04-2025 16:52 | ||||||||
| 09-04-2025 | 4052 | -21,00 | -104,00 | S21W0* | 316 | 316 | d | 0 | 0 | 0 | 0 | 0 | 0 | 0 | 0 | 0 | 0 | 0 | 0 | 04-04-2025 16:52 | ||||||||
| 09-04-2025 | 4054 | -12,00 | -44,00 | S12W44 | 256 | 256 | 180 | Dao | 8 | 4 | B | f | 0 | 0 | 0 | 0 | 0 | 0 | 0 | 0 | 40 | 5 | 1 | 1 | 05-04-2025 16:29 | |||
| 09-04-2025 | 4059 | 11,00 | 55,00 | N11E55 | 157 | 10 | Hrx | 1 | 1 | A | f | 0 | 0 | 0 | 0 | 0 | 0 | 0 | 0 | 10 | 1 | 1 | 1 | 09-04-2025 17:06 | ||||
| 09-04-2025 | 4046 | 7,00 | -92,00 | N07W92 | 304 | 302 | 110 | Hsx | 3 | 1 | A | f | 0 | 0 | 0 | 0 | 0 | 0 | 0 | 0 | 10 | 1 | 1 | 1 | 28-03-2025 09:20 | |||
| 09-04-2025 | 4057 | 8,00 | 27,00 | N08E27 | 185 | 185 | 10 | Axx | 0 | 1 | A | f | 0 | 0 | 0 | 0 | 0 | 0 | 0 | 0 | 5 | 1 | 1 | 1 | 07-04-2025 17:27 | |||
| 09-04-2025 | 4055 | 8,00 | -22,00 | N08W22 | 234 | 233 | 30 | Cro | 8 | 9 | BG | f | 4 | 0 | 0 | 0 | 1 | 0 | 0 | 0 | 0 | 40 | 5 | 1 | 1 | 05-04-2025 16:29 | ||
| 09-04-2025 | 4056 | -7,00 | 31,00 | S07E31 | 181 | 181 | 70 | Hsx | 2 | 1 | A | f | 0 | 0 | 0 | 0 | 0 | 0 | 0 | 0 | 10 | 1 | 1 | 1 | 06-04-2025 09:49 | |||
| 09-04-2025 | 4049 | -31,00 | -90,00 | S31W90 | 302 | 302 | f | 0 | 0 | 0 | 0 | 0 | 0 | 0 | 0 | 0 | 0 | 0 | 0 | 31-03-2025 07:29 | ||||||||
| 09-04-2025 | 4045 | -13,00 | -101,00 | S13W0* | 313 | 313 | d | 0 | 0 | 0 | 0 | 0 | 0 | 0 | 0 | 0 | 0 | 0 | 0 | 27-03-2025 17:04 | ||||||||
| 09-04-2025 | 4048 | -16,00 | -67,00 | S16W67 | 279 | 280 | 240 | Fac | 21 | 12 | BG | f | 2 | 0 | 0 | 0 | 0 | 0 | 0 | 0 | 0 | 90 | 35 | 5 | 5 | 29-03-2025 15:55 | ||
| 09-04-2025 | 4058 | 18,00 | -25,00 | N18W25 | 237 | 30 | Dao | 5 | 4 | B | f | 0 | 0 | 0 | 0 | 0 | 0 | 0 | 0 | 30 | 5 | 1 | 1 | 09-04-2025 08:53 | ||||
| 08-04-2025 | 4055 | 8,00 | -7,00 | N08W07 | 233 | 232 | 30 | Cro | 6 | 7 | B | f | 0 | 0 | 0 | 0 | 0 | 0 | 0 | 0 | 20 | 1 | 1 | 1 | 05-04-2025 16:29 | |||
| 08-04-2025 | 4054 | -12,00 | -30,00 | S12W30 | 256 | 255 | 240 | Dso | 6 | 13 | B | f | 0 | 0 | 0 | 0 | 0 | 0 | 0 | 0 | 50 | 10 | 1 | 1 | 05-04-2025 16:29 | |||
| 08-04-2025 | 4056 | -7,00 | 45,00 | S07E45 | 181 | 181 | 60 | Hsx | 2 | 1 | A | f | 0 | 0 | 0 | 0 | 0 | 0 | 0 | 0 | 10 | 1 | 1 | 1 | 06-04-2025 09:49 | |||
| 08-04-2025 | 4057 | 8,00 | 41,00 | N08E41 | 185 | 185 | 10 | Axx | 1 | 2 | A | f | 1 | 0 | 0 | 1 | 0 | 0 | 0 | 0 | 0 | 5 | 1 | 1 | 1 | 07-04-2025 17:27 | ||
| 08-04-2025 | 4050 | 28,00 | -80,00 | N28W80 | 306 | 305 | f | 0 | 0 | 0 | 0 | 0 | 0 | 0 | 0 | 0 | 0 | 0 | 0 | 02-04-2025 15:33 | ||||||||
| 08-04-2025 | 4053 | -9,00 | -75,00 | S09W75 | 301 | 300 | f | 0 | 0 | 0 | 0 | 0 | 0 | 0 | 0 | 0 | 0 | 0 | 0 | 04-04-2025 16:52 | ||||||||
| 08-04-2025 | 4046 | 7,00 | -76,00 | N07W76 | 302 | 302 | 160 | Hsx | 2 | 1 | A | f | 0 | 0 | 0 | 0 | 0 | 0 | 0 | 0 | 10 | 1 | 1 | 1 | 28-03-2025 09:20 | |||
| 08-04-2025 | 4049 | -31,00 | -76,00 | S31W76 | 302 | 302 | 10 | Bxo | 12 | 2 | B | f | 0 | 0 | 0 | 0 | 0 | 0 | 0 | 0 | 10 | 1 | 1 | 1 | 31-03-2025 07:29 | |||
| 08-04-2025 | 4048 | -16,00 | -54,00 | S16W54 | 280 | 279 | 320 | Fac | 20 | 34 | BG | f | 2 | 1 | 0 | 3 | 1 | 0 | 0 | 0 | 0 | 80 | 35 | 5 | 5 | 29-03-2025 15:55 | ||
| 08-04-2025 | 4044 | 21,00 | -110,00 | N21W0* | 336 | 335 | 110 | Dao | 6 | 3 | B | d | 0 | 0 | 0 | 0 | 0 | 0 | 0 | 0 | 0 | 0 | 0 | 0 | 27-03-2025 11:30 | |||
| 08-04-2025 | 4045 | -13,00 | -87,00 | S13W87 | 313 | 312 | f | 0 | 0 | 0 | 0 | 0 | 0 | 0 | 0 | 1 | 1 | 1 | 1 | 27-03-2025 17:04 | ||||||||
| 08-04-2025 | 4052 | -21,00 | -90,00 | S21W90 | 316 | 315 | f | 0 | 0 | 0 | 0 | 0 | 0 | 0 | 0 | 0 | 0 | 0 | 0 | 04-04-2025 16:52 | ||||||||
| 07-04-2025 | 4044 | 21,00 | -96,00 | N21W96 | 335 | 334 | 110 | Dao | 6 | 3 | B | f | 0 | 0 | 0 | 0 | 0 | 0 | 0 | 0 | 30 | 5 | 1 | 1 | 27-03-2025 11:30 | |||
| 07-04-2025 | 4049 | -30,00 | -63,00 | S30W63 | 302 | 307 | 30 | Eao | 11 | 3 | B | f | 0 | 0 | 0 | 0 | 0 | 0 | 0 | 0 | 25 | 5 | 1 | 1 | 31-03-2025 07:29 | |||
| 07-04-2025 | 4055 | 8,00 | 7,00 | N08E07 | 232 | 231 | 20 | Cao | 5 | 8 | B | f | 0 | 0 | 0 | 0 | 0 | 0 | 0 | 0 | 20 | 1 | 1 | 1 | 05-04-2025 16:29 | |||
| 07-04-2025 | 4045 | -13,00 | -73,00 | S13W73 | 312 | 312 | 10 | Axx | 1 | 1 | A | f | 0 | 0 | 0 | 0 | 0 | 0 | 0 | 0 | 5 | 1 | 1 | 1 | 27-03-2025 17:04 | |||
| 07-04-2025 | 4046 | 7,00 | -63,00 | N07W63 | 302 | 301 | 200 | Hsx | 3 | 1 | A | f | 0 | 0 | 0 | 0 | 0 | 0 | 0 | 0 | 10 | 1 | 1 | 1 | 28-03-2025 09:20 | |||
| 07-04-2025 | 4048 | -16,00 | -40,00 | S16W40 | 279 | 280 | 460 | Fkc | 21 | 39 | BG | f | 6 | 0 | 0 | 2 | 1 | 0 | 0 | 0 | 0 | 90 | 45 | 10 | 5 | 29-03-2025 15:55 | ||
| 07-04-2025 | 4052 | -21,00 | -76,00 | S21W76 | 315 | 314 | f | 0 | 0 | 0 | 0 | 0 | 0 | 0 | 0 | 0 | 0 | 0 | 0 | 04-04-2025 16:52 | ||||||||
| 07-04-2025 | 4051 | -8,00 | -98,00 | S08W98 | 337 | 336 | d | 0 | 0 | 0 | 0 | 0 | 0 | 0 | 0 | 0 | 0 | 0 | 0 | 04-04-2025 16:52 | ||||||||
| 07-04-2025 | 4053 | -9,00 | -61,00 | S09W61 | 300 | 299 | f | 0 | 0 | 0 | 0 | 0 | 0 | 0 | 0 | 0 | 0 | 0 | 0 | 04-04-2025 16:52 | ||||||||
| 07-04-2025 | 4054 | -13,00 | -16,00 | S13W16 | 255 | 255 | 240 | Dai | 6 | 19 | B | f | 0 | 0 | 0 | 0 | 0 | 0 | 0 | 0 | 65 | 15 | 5 | 1 | 05-04-2025 16:29 | |||
| 07-04-2025 | 4056 | -7,00 | 58,00 | S07E58 | 181 | 183 | 60 | Hsx | 1 | 1 | A | f | 0 | 0 | 0 | 0 | 0 | 0 | 0 | 0 | 10 | 1 | 1 | 1 | 06-04-2025 09:49 | |||
| 07-04-2025 | 4050 | 28,00 | -66,00 | N28W66 | 305 | 304 | f | 0 | 0 | 0 | 0 | 0 | 0 | 0 | 0 | 10 | 0 | 0 | 0 | 02-04-2025 15:33 | ||||||||
| 07-04-2025 | 4057 | 7,00 | 54,00 | N07E54 | 185 | 10 | Axx | 1 | 2 | A | f | 0 | 0 | 0 | 0 | 0 | 0 | 0 | 0 | 5 | 1 | 1 | 1 | 07-04-2025 17:27 | ||||
| 06-04-2025 | 4046 | 6,00 | -49,00 | N06W49 | 301 | 300 | 200 | Hsx | 3 | 1 | A | f | 0 | 0 | 0 | 0 | 0 | 0 | 0 | 0 | 10 | 0 | 0 | 0 | 28-03-2025 09:20 | |||
| 06-04-2025 | 4049 | -30,00 | -55,00 | S30W55 | 307 | 307 | 70 | Dao | 9 | 6 | B | f | 0 | 0 | 0 | 0 | 0 | 0 | 0 | 0 | 25 | 5 | 0 | 0 | 31-03-2025 07:29 | |||
| 06-04-2025 | 4052 | -21,00 | -62,00 | S21W62 | 314 | 314 | f | 0 | 0 | 0 | 0 | 0 | 0 | 0 | 0 | 1 | 0 | 0 | 0 | 04-04-2025 16:52 | ||||||||
| 06-04-2025 | 4048 | -16,00 | -28,00 | S16W28 | 280 | 280 | 480 | Fkc | 18 | 22 | BG | f | 2 | 0 | 0 | 1 | 0 | 0 | 0 | 0 | 0 | 90 | 45 | 10 | 0 | 29-03-2025 15:55 | ||
| 06-04-2025 | 4050 | 27,00 | -52,00 | N27W52 | 304 | 302 | 30 | Cao | 5 | 4 | B | f | 0 | 0 | 0 | 0 | 0 | 0 | 0 | 0 | 20 | 5 | 0 | 0 | 02-04-2025 15:33 | |||
| 06-04-2025 | 4053 | -9,00 | -47,00 | S09W47 | 299 | 298 | f | 0 | 0 | 0 | 0 | 0 | 0 | 0 | 0 | 10 | 0 | 0 | 0 | 04-04-2025 16:52 | ||||||||
| 06-04-2025 | 4044 | 21,00 | -82,00 | N21W82 | 334 | 334 | 110 | Dao | 6 | 3 | B | f | 0 | 0 | 0 | 0 | 0 | 0 | 0 | 0 | 25 | 5 | 0 | 0 | 27-03-2025 11:30 | |||
| 06-04-2025 | 4045 | -13,00 | -60,00 | S13W60 | 312 | 311 | 10 | Bxo | 5 | 2 | B | f | 2 | 0 | 0 | 3 | 0 | 0 | 0 | 0 | 0 | 10 | 0 | 0 | 0 | 27-03-2025 17:04 | ||
| 06-04-2025 | 4051 | -8,00 | -84,00 | S08W84 | 336 | 334 | f | 0 | 0 | 0 | 0 | 0 | 0 | 0 | 0 | 1 | 0 | 0 | 0 | 04-04-2025 16:52 | ||||||||
| 06-04-2025 | 4056 | -5,00 | 69,00 | S05E69 | 183 | 50 | Hsx | 2 | 1 | A | f | 0 | 0 | 0 | 0 | 0 | 0 | 0 | 0 | 10 | 0 | 0 | 0 | 06-04-2025 09:49 | ||||
| 06-04-2025 | 4054 | -12,00 | -3,00 | S12W03 | 255 | 255 | 110 | Dao | 5 | 9 | BG | f | 0 | 0 | 0 | 1 | 0 | 0 | 0 | 0 | 0 | 25 | 5 | 0 | 0 | 05-04-2025 16:29 | ||
| 06-04-2025 | 4055 | 9,00 | 21,00 | N09E21 | 231 | 231 | 10 | Axx | 2 | 2 | A | f | 0 | 0 | 0 | 0 | 0 | 0 | 0 | 0 | 5 | 0 | 0 | 0 | 05-04-2025 16:29 | |||
| 05-04-2025 | 4043 | 18,00 | -97,00 | N18W97 | 2 | 1 | 50 | Cao | 7 | 2 | B | d | 2 | 0 | 0 | 0 | 0 | 0 | 0 | 0 | 0 | 0 | 0 | 0 | 0 | 25-03-2025 14:23 | ||
| 05-04-2025 | 4051 | -8,00 | -70,00 | S08W70 | 334 | 335 | 10 | Cao | 5 | 4 | B | f | 1 | 0 | 0 | 0 | 0 | 0 | 0 | 0 | 0 | 20 | 5 | 1 | 1 | 04-04-2025 16:52 | ||
| 05-04-2025 | 4045 | -13,00 | -46,00 | S13W46 | 311 | 310 | f | 0 | 0 | 0 | 0 | 0 | 0 | 0 | 0 | 1 | 1 | 1 | 1 | 27-03-2025 17:04 | ||||||||
| 05-04-2025 | 4048 | -16,00 | -15,00 | S16W15 | 280 | 280 | 500 | Fkc | 18 | 28 | BG | f | 6 | 1 | 0 | 2 | 0 | 0 | 0 | 0 | 0 | 90 | 45 | 10 | 1 | 29-03-2025 15:55 | ||
| 05-04-2025 | 4053 | -9,00 | -33,00 | S09W33 | 298 | 297 | 10 | Bxo | 3 | 2 | B | f | 0 | 0 | 0 | 0 | 0 | 0 | 0 | 0 | 10 | 1 | 1 | 1 | 04-04-2025 16:52 | |||
| 05-04-2025 | 4050 | 31,00 | -37,00 | N31W37 | 302 | 304 | 10 | Dao | 4 | 3 | B | f | 0 | 0 | 0 | 0 | 0 | 0 | 0 | 0 | 25 | 5 | 1 | 1 | 02-04-2025 15:33 | |||
| 05-04-2025 | 4055 | 9,00 | 34,00 | N09E34 | 231 | 10 | Cro | 5 | 2 | B | f | 0 | 0 | 0 | 0 | 0 | 0 | 0 | 0 | 15 | 1 | 1 | 1 | 05-04-2025 16:29 | ||||
| 05-04-2025 | 4046 | 6,00 | -35,00 | N06W35 | 300 | 301 | 230 | Hsx | 3 | 1 | A | f | 0 | 0 | 0 | 0 | 0 | 0 | 0 | 0 | 10 | 1 | 1 | 1 | 28-03-2025 09:20 | |||
| 05-04-2025 | 4049 | -28,00 | -42,00 | S28W42 | 307 | 305 | 80 | Dao | 8 | 6 | B | f | 0 | 0 | 0 | 0 | 0 | 0 | 0 | 0 | 25 | 5 | 1 | 1 | 31-03-2025 07:29 | |||
| 05-04-2025 | 4044 | 22,00 | -69,00 | N22W69 | 334 | 335 | 130 | Dao | 3 | 4 | B | f | 0 | 0 | 0 | 0 | 0 | 0 | 0 | 0 | 25 | 5 | 1 | 1 | 27-03-2025 11:30 | |||
| 05-04-2025 | 4052 | -21,00 | -49,00 | S21W49 | 314 | 313 | 10 | Cso | 5 | 4 | B | f | 0 | 0 | 0 | 0 | 0 | 0 | 0 | 0 | 15 | 1 | 1 | 1 | 04-04-2025 16:52 | |||
| 05-04-2025 | 4054 | -13,00 | 10,00 | S13E10 | 255 | 20 | Cao | 3 | 6 | B | f | 0 | 0 | 0 | 0 | 0 | 0 | 0 | 0 | 20 | 5 | 1 | 1 | 05-04-2025 16:29 | ||||
| 04-04-2025 | 4044 | 22,00 | -57,00 | N22W57 | 335 | 336 | 150 | Dao | 5 | 5 | B | f | 0 | 0 | 0 | 0 | 0 | 0 | 0 | 0 | 25 | 5 | 1 | 1 | 27-03-2025 11:30 | |||
| 04-04-2025 | 4052 | -21,00 | -35,00 | S21W35 | 313 | 10 | Cro | 5 | 4 | B | f | 1 | 0 | 0 | 0 | 0 | 0 | 0 | 0 | 0 | 15 | 1 | 1 | 1 | 04-04-2025 16:52 | |||
| 04-04-2025 | 4049 | -28,00 | -27,00 | S28W27 | 305 | 304 | 60 | Dao | 8 | 8 | B | f | 0 | 0 | 0 | 0 | 0 | 0 | 0 | 0 | 25 | 5 | 1 | 1 | 31-03-2025 07:29 | |||
| 04-04-2025 | 4050 | 28,00 | -25,00 | N28W25 | 304 | 307 | 10 | Dso | 4 | 3 | B | f | 0 | 0 | 0 | 0 | 0 | 0 | 0 | 0 | 20 | 5 | 1 | 1 | 02-04-2025 15:33 | |||
| 04-04-2025 | 4053 | -9,00 | -19,00 | S09W19 | 297 | 10 | Cro | 3 | 2 | B | f | 0 | 0 | 0 | 0 | 0 | 0 | 0 | 0 | 15 | 1 | 1 | 1 | 04-04-2025 16:52 | ||||
| 04-04-2025 | 4045 | -13,00 | -32,00 | S13W32 | 310 | 310 | 20 | Cso | 3 | 3 | B | f | 0 | 0 | 0 | 0 | 0 | 0 | 0 | 0 | 15 | 1 | 1 | 1 | 27-03-2025 17:04 | |||
| 04-04-2025 | 4047 | -15,00 | -109,00 | S15W0* | 27 | 27 | d | 0 | 0 | 0 | 0 | 0 | 0 | 0 | 0 | 0 | 0 | 0 | 0 | 28-03-2025 17:30 | ||||||||
| 04-04-2025 | 4043 | 18,00 | -83,00 | N18W83 | 1 | 2 | 50 | Cao | 7 | 2 | B | f | 3 | 0 | 0 | 0 | 0 | 0 | 0 | 0 | 0 | 20 | 5 | 1 | 1 | 25-03-2025 14:23 | ||
| 04-04-2025 | 4046 | 6,00 | -23,00 | N06W23 | 301 | 299 | 160 | Hsx | 3 | 1 | A | f | 0 | 0 | 0 | 0 | 0 | 0 | 0 | 0 | 10 | 1 | 1 | 1 | 28-03-2025 09:20 | |||
| 04-04-2025 | 4048 | -16,00 | -2,00 | S16W02 | 280 | 278 | 530 | Fkc | 16 | 32 | BG | f | 1 | 0 | 0 | 1 | 0 | 0 | 0 | 0 | 0 | 90 | 45 | 10 | 1 | 29-03-2025 15:55 | ||
| 04-04-2025 | 4051 | -8,00 | -57,00 | S08W57 | 335 | 10 | Cro | 1 | 3 | B | f | 0 | 0 | 0 | 0 | 0 | 0 | 0 | 0 | 15 | 1 | 1 | 1 | 04-04-2025 16:52 |
Visit the AAVSO page for more information about sunspot classifications.
Solar Flux (SFI) is a simple measurement which is immediately available, unlike the SunSpot Number (SSN) which requires processing. The solar flux is measured at several frequencies, the value at 2800MHz being considered the best measure. There is a correlation between the SSN and the flux but the widely scattered points show that this is an approximate relationship and not the simple curve shown, which is often assumed in MUF predictions.
The SFI is one of the longest running records of solar activity. The 2800 MHz radio emissions originate high in the chromosphere and low in the corona of the solar atmosphere. It correlates well with the sunspot number as well as a number of UltraViolet (UV) and visible solar irradiance records. It’s been measured consistently in Canada since 1947. Unlike many solar indices, the F10.7 radio flux can easily be measured reliably on a day-to-day basis from the Earth’s surface, in all types of weather. It’s reported in “solar flux units”, (SFU), and can vary from below 50 to above 300 over the course of a solar cycle.

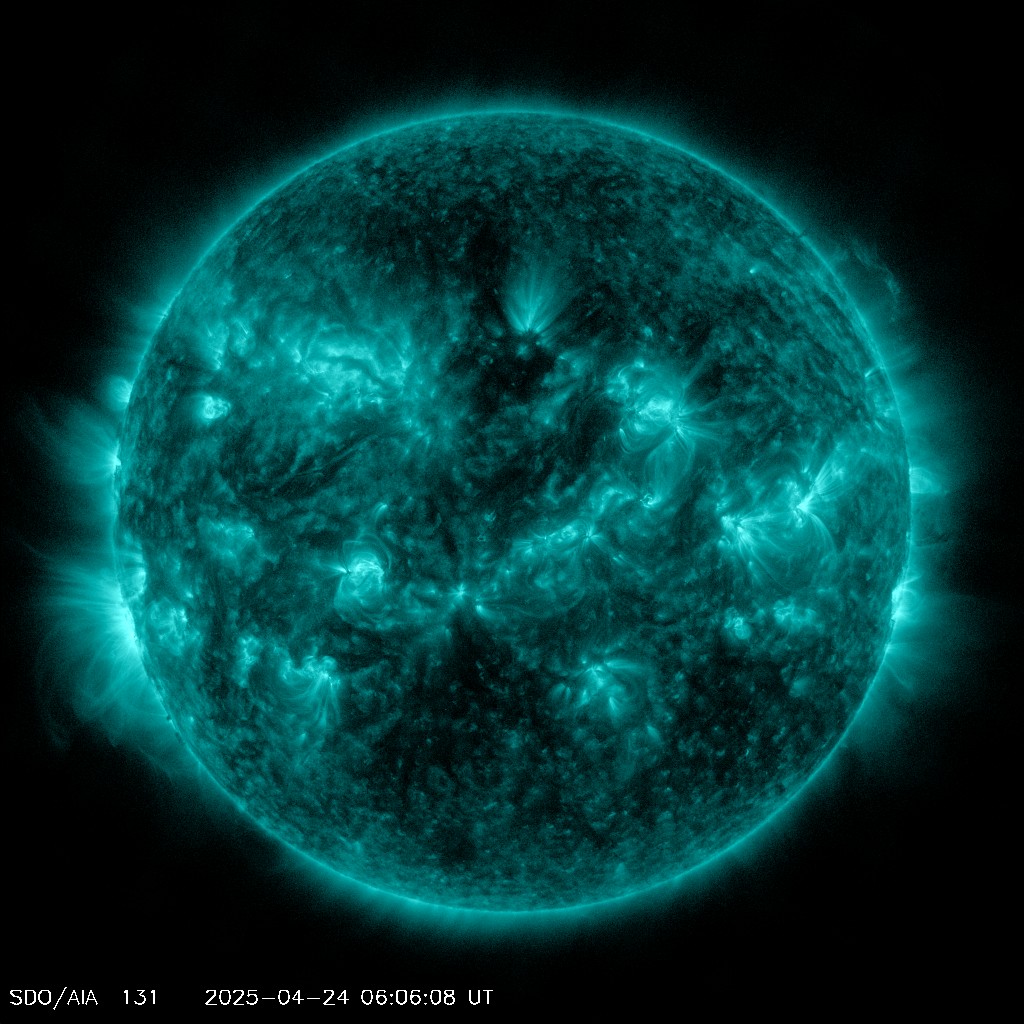
This channel highlights the outer atmosphere of the Sun – called the corona – as well as hot flare plasma. Hot active regions, solar flares, and coronal mass ejections will appear bright here. The dark areas – called coronal holes – are places where very little radiation is emitted, yet are the main source of solar wind particles.